Blog

  • Why continuous forecasting is more enjoyable

    The case for continuous forecasting

    Time for a confession. I really hated forecasting back in my old job. Kind of crazy since I was working with clients on improving their planning, budgeting & forecasting processes. Yet, I absolutely hated doing my own forecast. What was wrong? First of all, the template was terrible. Way too much detail. It took me hours to get it done. Luckily, I only had to do this 2-4 times per year. But that was also part of the issue. Every time I received the updated template I had to start from scratch and enter a ton of data. Also, I had to re-orient myself and figure out how the template worked this time. And then there was the reconciliation between my project plans and the prior forecast. To sum it up: The ramp-up time was simply too long. It was awful. But there is a better approach: Continuous forecasting

    Fire-drill

    Indeed, the typical process for updating, distributing, collecting and aggregating forecasting templates can take up to a few weeks in many companies. Part of the issue is that the forecast templates are often unavailable to the user community. Analyst need to maintain and update hundreds of spreadsheet templates between forecasts (formula fixes, structural changes, data loads). The process looks something like this:

    Traditional Forecasting Process
    The traditional spreadsheet-driven process

    At the start of a forecast cycle, templates are distributed. Many business people feel overwhelmed at that point. Starting from scratch is always tough. You have to orient yourself, your have to build numbers up etc.. As a result, business people feel that forecasting resembles a fire-drill.

    Forecasting software

    But there is a much better approach that many of my clients have implemented. Modern planning & forecasting software allows us to keep our forecasting templates online nearly 24*7. Forecasting software like IBM Cognos TM1 automates and significantly enhances all those manual tasks such as formula fixes, data loads, aggregations, etc.. Overall maintenance is a lot easier and the templates can be online allowing the users to work with their forecast data around the clock. Forecasters can therefore perform quick incremental changes to their forecast instead of performing time-consuming, infrequent larger data input exercises. But what is the advantage of doing that? Very simple: Incremental effort is always easier and faster than ramp-up tasks. Think about your personal life: If you spend ten minutes per day cleaning up for desk or office, everything will be in good shape. But if you let things slip for a week or two, cleaning up suddenly becomes a daunting task. This is what the process can look like:

    Continuous Forecasting
    The continuous forecasting process

    Continuous Forecasting

    Does this work? Absolutely. I have experienced this myself. After every client visit, I spent a few minutes updating my forecast. A lot of my clients have implemented this approach. Clients typically experience three main advantages:

    • The more often you work with a system the more comfortable you become. Users tremendously benefit from that. Their efficiency increases.
    • The actual forecast process is a lot faster for the business users. Finance is able to reduce cycle-time.
    • Forecasts tend to be more complete. In the case of an urgent ad-hoc forecast (imagine something critical happened), the business is able to compile a near complete forecast in within a short period of time.

    But the Finance department now has to carefully manage this process and clearly communicate timelines and expectations to the business. Submission deadlines need to be crystal clear.

    Let me clarify one last thing: A continuous process does NOT mean I can simply aggregate my data every night and obtain an updated forecast. No, I need to communicate to the business WHEN I need the data. But due to the 99% availability I can collect my data very quickly.

    Continuous forecasting can be a powerful approach! Would love to hear your thoughts and experiences. Good or bad. If you are interested in this topic, why don’t you join of our Rolling Forecast workshops or IBM Finance Forum?

  • Dashboard Design Advice: Avoid eye contact at all cost!!!

    Dashboard Design

    When I watch interviews with international sports stars, I sometimes have to laugh. Every inch of their clothing is plastered with logos from sponsors. It’s usually impossible to see or remember even a single one of them amidst this smorgasbord. We can spot a similar overload problem in many dashboards and reports. Corporate logos and stock photographs are injected to “enhance” the visual appearance of the objects. This is bad enough but some pictures are worse than others. Two weeks ago I saw an example of that. Several reports and dashboards featured photos of beautiful eyes. It was supposed to be a metaphor for business insight. Such a shame – it simply did not work.

    Focal Point: Eyes

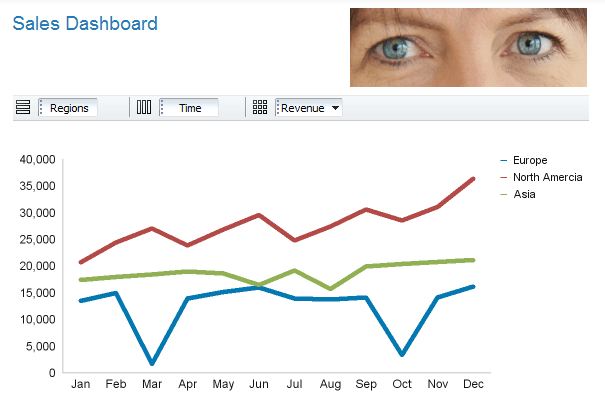
    Decoration hardly ever motivates people to effectively consume information. On the contrary, photos and logos usually steals attention and waste valuable space. And human eyes are especially ill-suited as embellishment for reports or dashboards. Here is why: Eyes demand people’s attention (this is called visual weight) and they rank before anything else when we look at a photograph, a picture or a dashboard. Our eyes automatically gravitate towards that part. It’s like a magnet – eyes attract eye contact. And that pretty much explains why we should not include photos of eyes in our dashboards or reports. Take a look at the example below.Dashboard Logo

    Notice how you keep jumping back to look at the eyes. This is a simple example, of course. Imagine if this was a full-screen dashboard. Your eyes would constantly flip back and forth between content and those blue eyes. Focus is lost. Plus there is the obvious question – why do we need to include the eyes here in the first place? They do not add any value whatsoever.

    Let’s look at the better version.

    Dashboard DesignNotice the difference? You are now able to focus on the chart. There is no distraction.

    A lesson for report & dashboard design

    Next time you design a report or dashboard, delete those logos and photos. Most of them do not add any value, anyway. The objective of proper report and dashboard design is to deliver information in the best possible way. Human eyes represent one of the biggest possible distractions. Images of eyes clearly have no space in report and dashboard design. Hence my advice for the day: Avoid eye contact at all cost!

  • The other side of Cognos Insight – A powerful planning client for TM1 (Guestpost)

    Cognos Insight and TM1

    There is a lot of buzz about Cognos Insight. It is a great tool for analyzing and discovering data. There is also the ability to perform powerful what-if analysis through the use of write-back capabilities. But Cognos Insight is actually more than just a personal desktop analytics tool. You can use it to create visually appealing planning applications for IBM Cognos TM1.

    An awesome planning client

    Many business users literally hate the mandatory planning, budgeting and forecasting processes. Part of the issue are the cumbersome spreadsheet templates. Cognos Insight provides a radically new approach. You can develop visually appealing applications that connect directly to your TM1 model. Here are some of the great things you can do with Cognos Insight:

    • Create detailed instructions for the planning or forecasting process
    • Instructions can include images and hyperlinks
    • Automate process steps by including action buttons
    • Provide additional planning context by including dashboards that connect to your Cognos 10 models

    To do that, you simply have to connect Cognos Insight to the workflow of a specific TM1 planning application.

    Cognos Insight and TM1

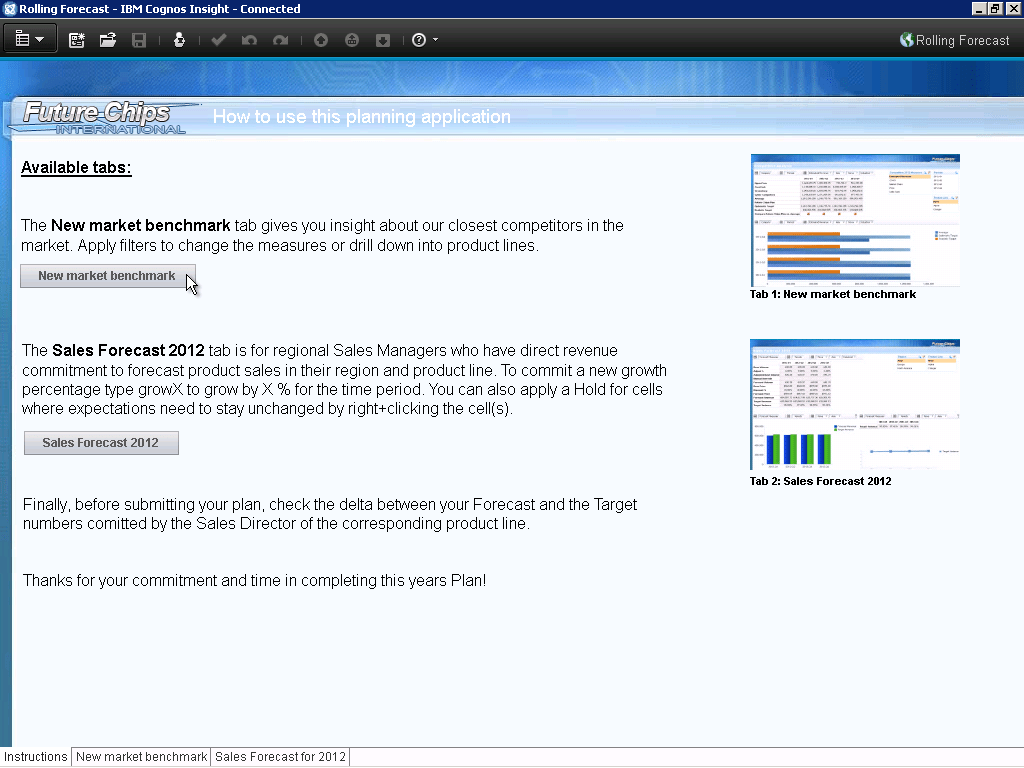
    Let’s take a look at a simple example – a sales forecasting model. It is a well-known best practice to include specific instructions in a planning template. That helps the business understand the model and to identify specific tasks that they need to focus on. Cognos Insight allows you to insert text boxes, images and hyperlinks. Action buttons make it easy for casual users to jump between different planning pages and cubes. The result is a clean-looking set of pages.

    Cognos Insight TM1

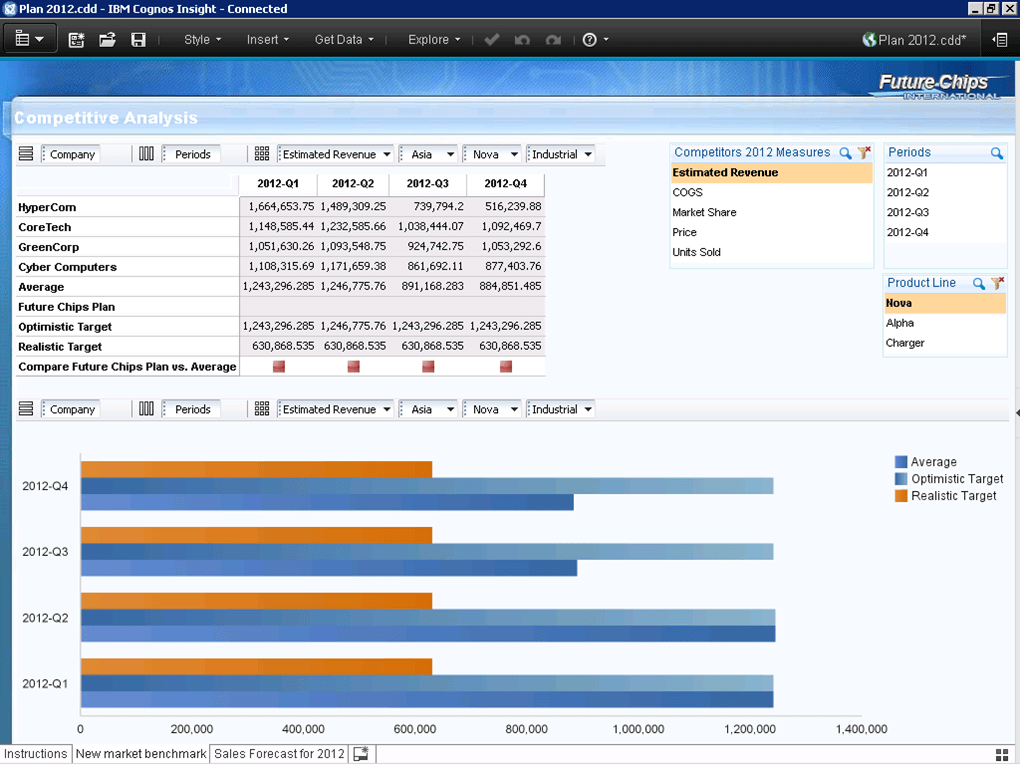
    Planning and forecasting should go hand-in-hand with analysis. Cognos Insight allows you to include dashboards and reports from your Cognos 10 or TM1 environment. This makes it very easy and pleasant for the business people:

    Cognos Insight Dashboard

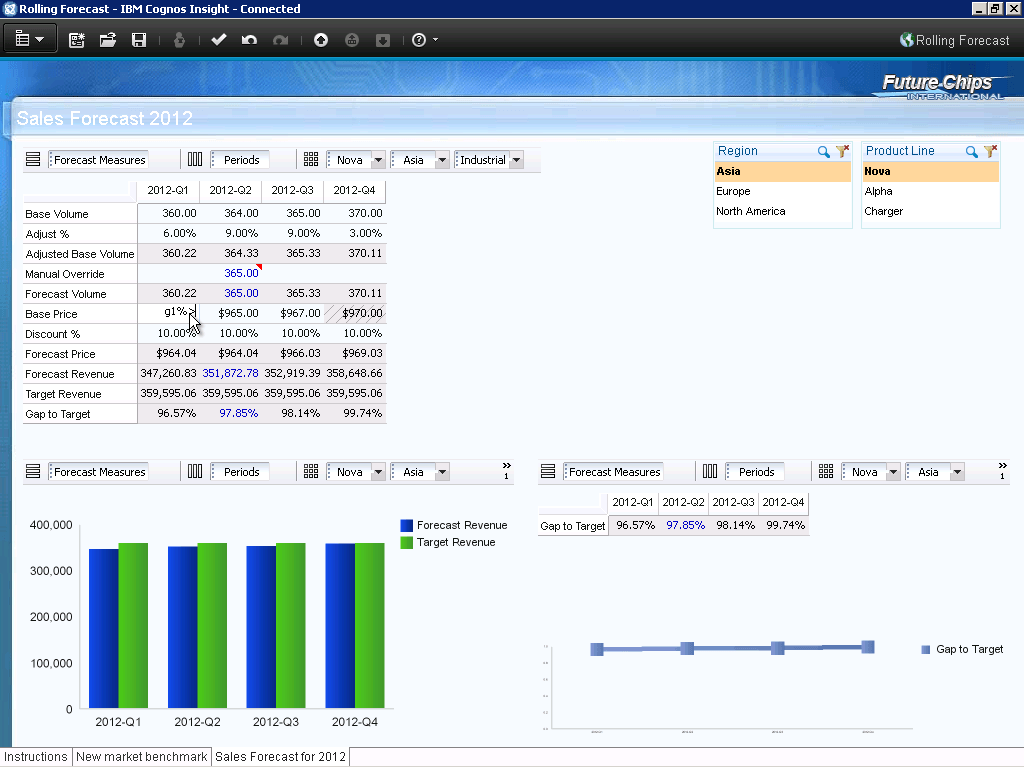
    You can finally also include traffic lights and real-time charts right in your actual planning application. This provides users with instantaneous & visual feedback. We all know that a picture says more than a thousand words, right?

    Cognos Insight TM1

    Last but not least, you can also leverage great short-cuts for entering data.

    Cognos Insight & TM1

    Cognos Insight is much more than just a personal analytics tool. Using it as a client for TM1-based planning or forecasting models offers up some fantastic opportunities. Business users love the visual and interactive applications you can build. Is it hard to create these applications? No, not really. All it takes is drag and drop.

    Paul BremhorstAbout our guest blogger – Paul Bremhorst

    Paul is currently working as a Solution Architect for the IBM Business Analytics Product Marketing team. He joined Cognos as a BI Consultant in 2007 from a background of developing sales reports in the banking and finance sector. He lives in beautiful Stuttgart, Germany and loves to ride his motorcycle.


  • What my car taught me about designing a successful dashboard

    A useful dashboard?

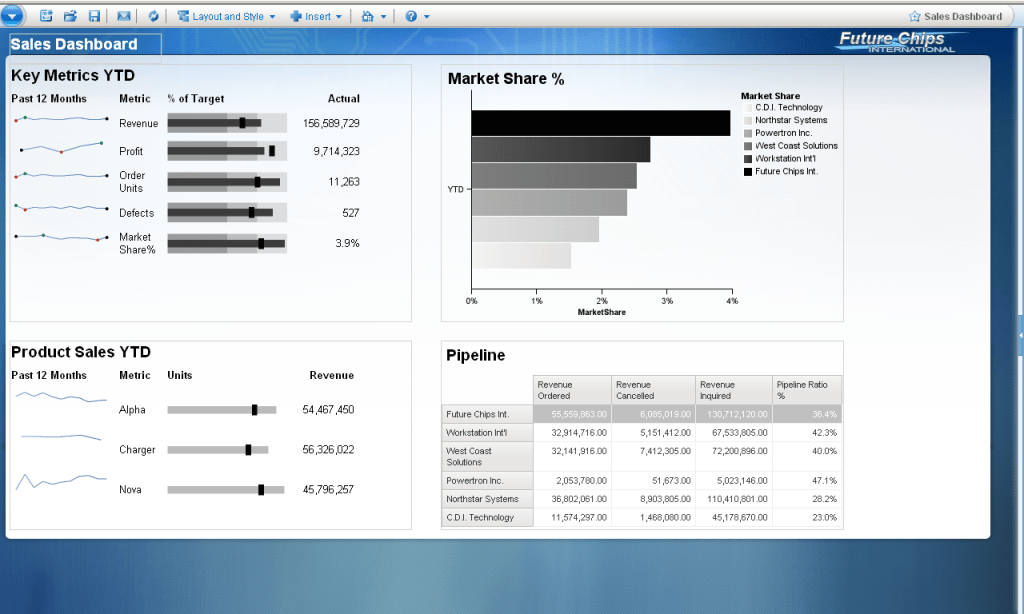
    The other day, a former colleague sent me several screenshots of a ‘dashboarding solution’ a new team member had proposed to him. What I saw was wild: A set of complex, colorful and overloaded screens. Not just one screen, but a whole book of different pages. There were long tables mixed with colorful gauge charts. It took me a few minutes to understand what was happening. This was clearly not a dashboard but rather a poorly designed reporting application. A dashboard is meant to provide us with a quick overview of our most critical business information. It is not supposed to deliver us a 360 degree detailed view.

    Unfortunately, too many dashboards are too complex these days. They fail to provide information at a glance. Overly complicated and saturated screens frustrate managers. To avoid project failure we should apply careful restraint during the dashboard design process. I have found that the dashboard in my car provides inspiration for that.

    Dashboard

    The car dashboard

    Car dashboards are quite brilliant. They allow us to obtain critical information within a split of a second. How do they manage to do that? Here are some reasons why:

    • Simple – How long does it take to understand the dashboard of a new car? The answer is: It takes a few seconds. The car dashboards are deceptively simple. You don’t need the manual to understand how it works.
    • Compact – They are compact. There is a single screen. We don’t have to scroll through multiple screens to find out how fast we are going.
    • Uncluttered – Most car dashboards are super clean and uncluttered. Colors are carefully selected. There aren’t any logos. Every object has a clear purpose. It would be hard to take anything away.
    • Visual – Yes, they are visual. Visuals are easier to read than text. We do not find a table with our historical speed and RPM in the dashboard. Reading that would take too long and it would take the focus away from the road.
    • Important– Only the most important information is displayed.Everything serves a clear and distinct purpose. It would be almost impossible to take anything away.
    • Exceptions – Identifying problems is really simple – a red icon will immediately alert us. We don’t have to go digging for that critical information.
    • Entry point – Modern cars allow us to drill-down whenever there is an exception. But that is truly optional. The dashboard simple acts as the entry point and not more than that.

    Your management dashboards

    Next time you design a performance dashboard, think about this list. A lot of those qualities should also apply to your reports. It is our job as business analytics professionals to make it easy for managers and knowledge workers to turn data into information. But to do that, we need to pay attention to the design process.

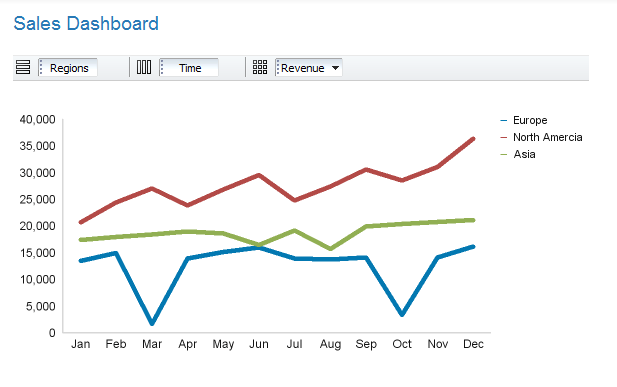
    Sales Dashboard

  • The reputation of business forecasting is not positive – Time for change!

    Business Forecasting

    The budgeting and business forecasting processes often have a poor reputation in many companies. Part of the issue is that the people involved in the process do not see a lot of value in it. Last year in November, two of my colleagues and I conducted a survey amongst 162 senior finance professionals in the UK.  One section of the short questionnaire focused on the value and the perception of the business forecasting process.

    Good is the enemy of great

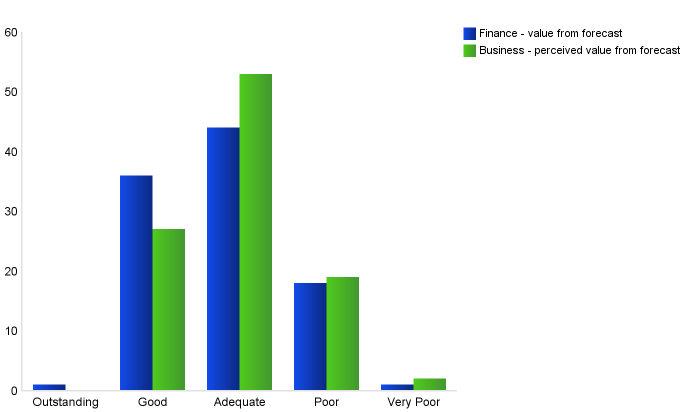
    The survey asked finance professionals two different questions:

    • How do you rate the value that you get out of the forecasting process?
    • How does the business rate the value they get out of the forecasting process?

    Here is what we found:

    Business Forecasting
    Business Forecasting: Low satisfaction & value

    The results are sad – not necessarily surprising, though. Only 37% of the finance people rate the value they receive from the forecast process as good or outstanding. The rest feel it is just adequate or poor. It gets worse when we look at the business users. Less than 27% feel they receive good value.

    Some people might be tempted to say that the results are not that bad. Be careful, though. Business forecasting is a critical process in turbulent times. And it is time-consuming in many organizations. We should therefore not be satisfied with ‘adequate’ or ‘poor’. Imagine we would apply the same standard to our personal life? It would be a very sad life, indeed. Or think about professional athletes – they would not put up with ‘adequate’ materials or training plans. That would put them in the lower performance bracket.

    Time for change

    Take a look at your business forecasting processes. How satisfied is finance? What about the business? We should not accept ‘adequate’ or ‘poor’ for an answer. The stakes are too high. And we should not waste our valuable time managing low-value processes.

    It’s time for change! In one of the upcoming posts,  I will write about some of the reasons that lead to the poor perception of the business forecasting processes. In the meantime, you can find ideas for improving your processes on this blog. Alternatively, pick up the fantastic book Future Ready: How to Master Business Forecasting. The authors Steve Player and Steve Morlidge have done a fine job of providing insightful best practices.

    Remember the words of management researcher Jim Collins: “Good is the enemy of great.”

  • I see a cake on the horizon! Meteolytix use predictive analytics to drive success

    Meteolytix

    Predictive analytics are an extremely hot and interesting area for most organizations. No wonder, there are some extremely cool and amazing use cases. Let’s take a look at a sweet example: cake. Bakeries around the world struggle with either reducing their waste or maximizing their potential. There are days when cakes seem to be flying off the shelves. And then there are bad days when baskets full of fresh goods have to be thrown away. Finding the right balance required luck and a great amount of intuition in the past. But the German company Meteolytix has found a better way. They have developed powerful sales forecast models that utilize weather data, historical sales and information about other contributing factors. The result is a self-learning automatic closed loop statistical model which increases revenue and lowers costs by minimizing over- and under-production. IBM SPSS is at the heart of this amazing solution.

    Predictive Analytics at work

    CakeHow does this work? Meteolytix offer their services to a number of large bakery chains across Germany. The Meteolytix teams feed predictive models with data that is collected from a range of sources: weather data from worldwide sensors and systems, daily sales figures from store POS systems and historical sales figures from ERP systems. Data flows into a customer-specific predictive model. The system determines daily sales forecasts for each branch and each product and dispatches them to the customer’s systems. The insights enable more exact material requirements planning, production and logistics optimization as well as considerable reduction in returns. Better control of stock levels creates increased sales and greater customer retention, and less waste of valuable food.

    Better performance

    Meteolytix‘s approach works. Their customers are able to reduce returned goods by approximately 33%. In addition, their customers are able to streamline the order process which saves many hours of work. The output from the models can also be used for workforce planning. I am pretty sure that this is just the beginning. Take a look at the new TV spot that features this use case. It’s fun!

    The Meteolytix story

    The Meteolytix story is very intriguing. They have a small team, yet they are able provide measurable and very impressive ROI to their clients. Think about your business – how could you apply predictive analytics? Do you have any interesting stories to share?

    You can find a detailed case study about Meteolytix on this URL.

    P.S.: Many thanks to my good friend Jen Rolfe for providing me with the delicious photo. She is a very talented baker.

  • An Easter Egg hunt with three charts

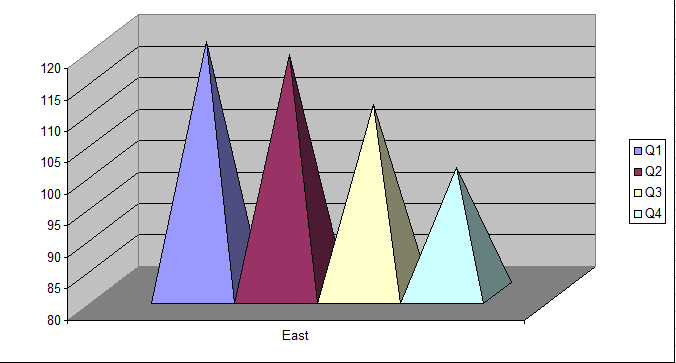
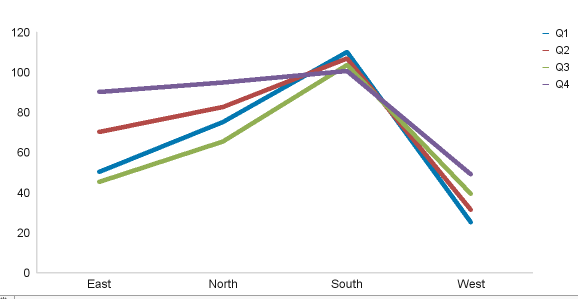
    It’s that time of the year. Millions of kids are excited about hunting for Easter Eggs. Why not do the same here on the blog? Below are three charts. All of them are colored according to the season. But there are some problems with each one of the charts. Can spot them? Scroll down to see some comments….

    Chart 1 – The Lollipop of Products

    The Lollipop – Makes sense?

    Chart 2 – The Pyramid of Deception

    Pyramid Chart
    The Pyramid – Admired for its shape and power

    Chart 3 – Walk that line

    Wrong Line Chart
    The trend is your friend? Or maybe not?

    (more…)

  • “Focus is key for success” says the German Cognos User Group

    The German Cognos User Group

    Last year, I posted an interview with Steve Veilleux, president of the Quebec Cognos User Group. This article has gotten a lot of attention. I therefore decided to reach out to another very successful user group: The German Cognos User Group. The three leaders of this organization volunteered for an interview. Please meet Kai Noack, Martin Otto and Erik Purwins.

    Cognos User Group

    Christoph: What is the purpose and mission of your Cognos User Group?

    Kai Noack: Our group has a clear mission:

    • Provide a forum for IBM Cognos users to exchange knowledge and share experiences.
    • Provide deep expertise in all IBM Cognos related questions via newsletters and conferences.
    • Connect with IBM management to discuss trends and potential issues.

    We cover all IBM Cognos products (BI, Performance Management, etc.).

    Christoph: How many members do you have and how do you communicate with each other?

    Martin Otto: Our group was founded back in 1998. Membership has grown membership rapidly. We currently have over 300 active members from over 100 different companies. The group targets German speaking associates: 95% come from Germany and the remaining 5% are spread between Austria and Switzerland. Our roster of associates features active Cognos users, administrators, project managers and consultants.

    We have three main communication channels:

    • The website is our hub. It provides news, updates and other relevant information. There is also a discussion forum.
    • Frequent newsletters
    • Seminars and conferences are the ‘glue’ that hold our group together. We organize a bunch of those every year. They are very successful and provide us with the ability to develop long-lasting relationships.

    Christoph: Do you have to pay to become a member? If yes, how much and how do you utilize the funds?

    Erik Purwins: Our group is completely independent. IBM does not sponsor us. Anybody who is interested in IBM Cognos and Business Analytics can join our group. But we do charge for the membership. There are currently two types of memberships: Personal (100 EUR p.a.) and corporate (EUR 250 p.a.). The corporate model is very attractive as it allows up to 20 people from an organization to participate in our activities. The majority of our members have a corporate account.

    The fees that we collect are used for several purposes: maintenance of our website, conferences and marketing. German law also requires us to utilize a professional accountant and external tax advisor.

    Christoph: What are the benefits of being a member in the German Cognos user group?

    Kai Noack: There are a number of benefits for our members:

    • Education – we have a big focus on knowledge sharing. Our members have diverse backgrounds and have a lot of accumulated knowledge.
    • Problem solving – our community allows us to jointly solve problems
    • Direct connection to IBM – we enjoy an excellent relationship with IBM. This allows us to voice concerns, share ideas and obtain critical information
    • Ability to detect trends – we frequently invite guest speakers and conduct polls
    • Fun – our members really enjoy being part of the group. We are all passionate about business analytics. Being surrounded by like-minded professionals is fun and rewarding.

    We strongly believe that our group is contributing to the success of the different IBM Cognos implementations in the German speaking countries. As a matter of fact, members claim that being part of the group feels like having a professional consultant available 24/7. Our combined knowledge is that rich and deep.

    Christoph: Tell me more about your conferences.

    Martin Otto: We typically organize 4-6 conferences and workshops per year. Some of the meetings are more general, others focus on a specialized topic. Two years ago, we hosted an event about running Cognos on mainframes, for example. The events are actually open to non-members as well. We do believe we profit from having a larger circle participate. Non-members typically pay a surcharge for participating.

    We usually invite at least one representative from IBM. This provides all members with the ability to have a direct connection to IBM. At the same time, IBM benefits from being able to connect with their loyal customers. It’s a win-win situation.

    Christoph: There are some regions that do not have a user group. What advice would you have for IBM Cognos sponsors and users who are thinking about forming or joining a similar user group?

    Erik Purwins: There are certainly a lot of lessons.

    • We highly recommend defining a clear vision for the group. Our group is focused on technical topics, for example. Having that vision provides clarity and drives success. Members know what to expect when they join us. The majority of them either have a technical background or they enjoy discussing the technical topics.
    • Organize professional meetings. As mentioned earlier, they are the glue for our group. We do charge a small fee for all our meetings (in addition to the annual fee). That allows us to provide the best possible service (great locations, professional setup, etc..). Charging for attendance also acts as a filter for those people who are not passionate about the topic.
    • The conferences need to be focused and need to feature relevant content. Speakers are highly encouraged to focus on specific lessons-learned that benefit the attendees. Our members therefore have the ability to gain a tremendous amount of knowledge.
    • Edit your content. We actively discourage ‘sales and marketing’ type content. We learned our lesson early on when some people ‘hijacked’ a meeting to sell their services or software. Our group is not a market place for selling. Our members expect to learn something when they join our organization.

    Christoph: Thanks much for your time!

    You can find out more information about the German Cognos User Group on their homepage.

  • Are you kidding me? There is more than just the tools!

    Wasted time

    Do you enjoy wasting time? I surely don’t and I do not have patience engaging in activities that do. Unfortunately, over the past few months I did witness several completely useless discussions about tools and their specific features and functions. So much wasted time and energy! While everybody focused on boasting & bitching, core issues were completely ignored. This is so wrong! But let’s back up for a second…

    Tools, tools, tools

    Toolbox
    It's always about the tools, isn't it?

    Back in February, my favorite camera manufacturer released a groundbreaking piece of equipment. The discussion forums and relevant blogs were going crazy for a while. People expressed their enthusiasm for the new features. However, the general tone in the discussion forums quickly turned sour. Photographers were lashing out at each other. It got really stupid (“Do you know how to count megapixels!”) and the discussions were far removed from the subject that should be at the core: photography. Photography is about taking great photos that touch people. It’s not about pixel peeping. One person made an especially smart comment: “Finally. This is the camera that provides me with endless freedom. All other cameras in the market have limited my creativity so far.” Oh well…..I am sure Ansel Adam would hold his belly laughing on the floor. His creativity was truly limited by his huge camera and the heavy stacks of film plates…..NOT!

    Business Analytics

    There is a similar issue in business analytics. We sometimes spend too much time thinking and talking about the tools. Back in my Big 5 days, I sat with a client who was very dissatisfied with his BI tools from a certain vendor. He claimed that the lack of gauge charts amongst two other things explained the low user adoption. Guess what – the company bought a different tool but the dashboards still sucked. Why? They thought the tool would provide a miracle fix. All their discussions were focused on the tools and not the business process. I am still 100% sure that they could have built a highly valuable solution with their old software. Granted, it did not look sexy. But it was highly functional. Time for a reality check: High-pixelated garbage is still worse than a low-resolution masterpiece.

    Pie Chart
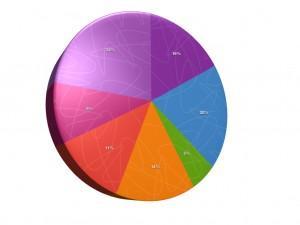
    High-pixelated garbage?

    “Men have become the tools of their tools.” Henry David Thoreau

    What’s the issue here? A ton of time is wasted discussing tools. The sad truth is that a new tool won’t guarantee success. Poor data sources, sloppy business processes or lack of user engagement are often counteracting the new benefits.  etc.. Better tools alone won’t create better output. It takes skills to put the tools to good use. A poorly composed photograph that was taken with an expensive camera is still a crappy picture. A poorly designed dashboard built with an expensive tool will collect dust. It’s that simple. Ansel Adams is one of the most admired photographers out there. He used ancient tools. Would he have been able to make even better photos with today’s equipment? Most likely, but his photographs are still absolutely amazing.

    Tools Discussion
    Which photo was taken with an expensive camera?

    Work on your skills instead of wasting time.

    Don’t get me wrong. There is a time when it is really important to think about your tools. But it can’t be the constant focus. It’s easy and comfortable to drool over or to bash a set of features and functions. It’s a lot harder to put these tools to their best use. Pixel and dashboard peeping is a form of laziness. It distracts us from what’s important. Instead, we should take the time to hone our skills: data modeling, dashboard design, visualization techniques, business trends, etc.. My prior client that I mentioned earlier never took the time to work on the inputs for the dashboards.

    Well, I stopped reading the camera forums and have decided that the discussions won’t help me take better photographs. Instead, I have resorted to taking more photos, instead. Why don’t we take the time to sit down with our business partner and build a solid prototype? Why don’t we attend a training in report design? Why don’t we read an article about data visualization?


  • Why stacked line charts are useful

    Stacked line charts

    Stacked line charts are a great and yet simple tool. Here is why. We often run into a situation where we need to analyze data with different units of measure. Think about  a classic but yet simple situation: Vital company data such as revenue, margin % and expenses is used to obtain insights about the past and current performance . One could dismiss this as an easy task and simply review a standard table. But raw data is really tough to analyze. Detecting trends and patterns quickly is almost impossible. Especially with regular data sets that span multiple organizational units

    Analysis
    Raw data is hard to analyze. Even simple data sets as this one here.

    The other option would be to stick the data into a traditional line chart. But this won’t work in many cases for two obvious reasons:

    • The units of measure are different (Revenue ($), Margin (%), Headcount (#), Volume (#), etc..)
    • The units of measure have large differences (example: Revenue is measured in millions, travel cost in thousands)

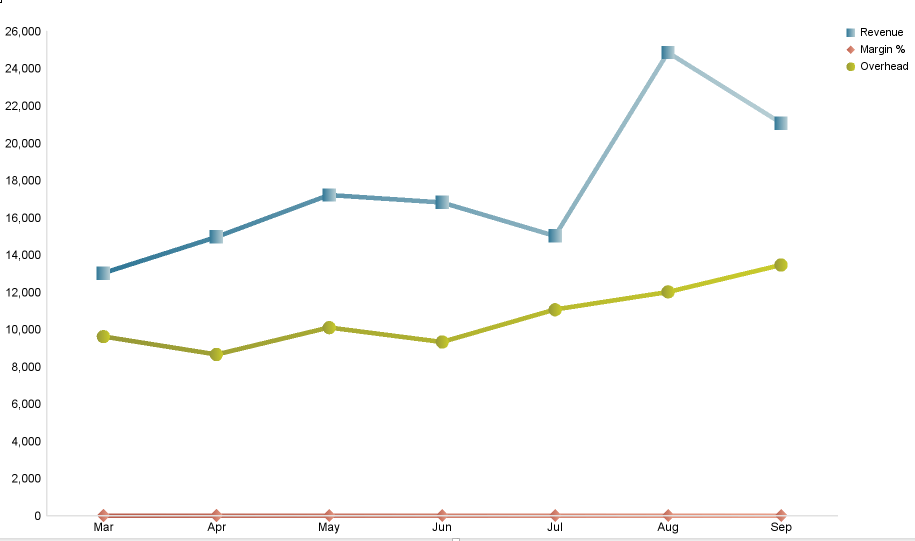
    Both cases result in a pretty much useless chart. You can see a fine example right below:

    bad line chart
    An almost useless chart – What are the margins again?

    For data sets containing just two different units of measure, we could alternatively consider a dual axis graph. But I personally find them distracting and many casual users get confused. This is where stacked line charts come in handy.

    The power of stacked line charts

    Stacked line charts are basically a bunch of line charts that we stack. Why is that useful? Well, take a look:

    Stacked line chart
    A stacked line chart – A better option

    The stacked line charts allows us to easily identify and compare the trends and patterns in our data. Using this stack is fairly easy. We just have to keep in mind that the units of measure or the scale is different in each one of the line charts. But that should be obvious.

    Your analysis

    Generating these stacked line charts is really easy with personal analytics tools like Cognos Insight. Spreadsheets typically required us to generate various different charts and to align them manually.

    If you haven’t use them before, get started today! Stacked line charts are very powerful, yet easy to use.