Blog

  • Is McGuyvering the right approach for your cloud data warehouse?

    Is McGuyvering the right approach for your cloud data warehouse?

    BOOM! I was on the final 15km of an extremely hot bike ride when things suddenly spiraled out of control. A grey piece of metal in the middle of the road had pierced my front tire and led to a forceful explosion. Luckily, I was able to avoid a crash. Here I was in the middle of a New Jersey forest on one of the hottest days of the year. Cell phone reception? Forget it. What to do? A new inner tube would have poked through and gotten pierced shortly after. Time to McGuyver! Two dollar bills neatly folded into the tire carcass helped keep the new inner tube somewhat protected. It wasn’t a pretty solution and the tire wobbled along. But it held up for 15km and got me home safely. 

    McGuyvering

    The classic 80s TV show MacGuyver was an international sensation and it helped coin the term McGuyvering. Its main character MacGuyver always managed to get out of hopeless situations by building ingeniuous contraptions out of ordinary things. According to the Oxford Dictionary, McGuyvering is to make or repair something “in an improvised or inventive way, making use of whatever items are at hand”. Think about the band-aid holding your broken glasses together. Think a combo of plastic bag and duct tape to fix a whole in your tent. While resourceful, McGuyvered solution are usually short-lived and not intended for long-term use.

    The modern data stack?

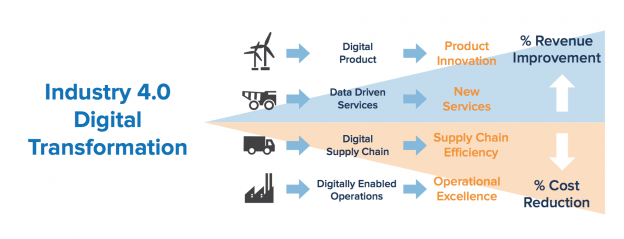
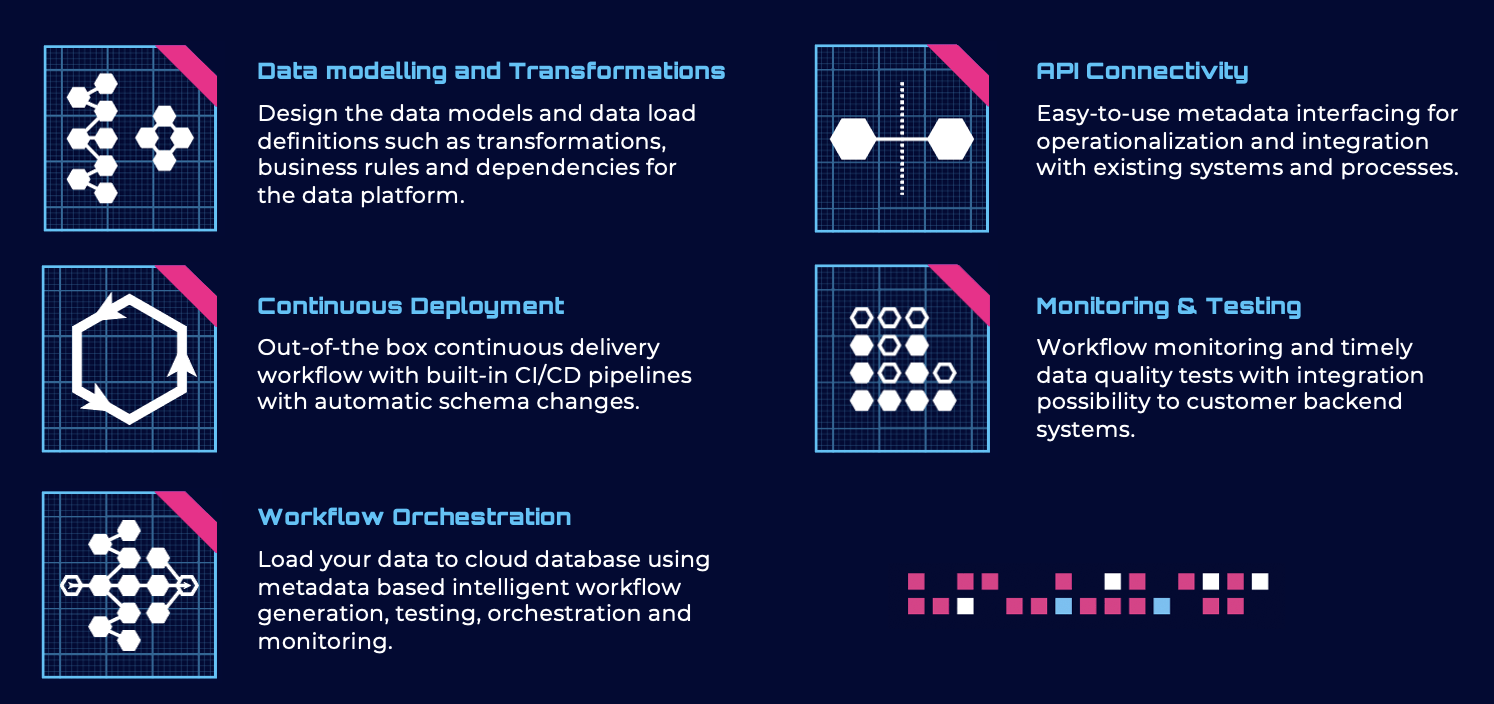
    What does the have to do with data? Over the course of my career I have witnessed many cases where organizations McGuyver solutions: combining different software solutions and methodologies to achieve a specific goal. It usually goes ok for some time but sooner or later something will spin out of control. The same thing is currently happening in the data warehousing space. There are a ton of spot solutions on the market that take care of a subset of tasks that need to be taken care of during the whole lifecycle of a cloud data warehouse. Some people call the set of these tools the ‘modern data stack’. No doubt that these solutions do a great job for their respective space. But when you use a concoction of disparate instruments that were never designed to work together, you might end up with not with a modern data stack but with a modern case of McGuyvering, instead.

    Sure enough, macros, scripts and work instructions then help keep things in working order for some time. But as soon as complexities increase, critical team members leave or upgrades kill fragile integration points, things can easily get out of control. You quickly end up losing valuable time, making compromises along the way and spending time fixing instead of building. And we haven’t even started talking about training people in all these different tools…. Is it really worth cutting corners in these volatile & exciting times?

    Enter: Agile Data Engine

    I recently joined Helsinki based Agile Data Engine. Back in 2016, our fabulous team had the vision to build a single platform to fully automate the design, build & operations processes for data warehouses. No McGuyvering required – just a single product. Fast forward to 2023 and over 40 customers in Scandinavia happily rely on the Agile Data Engine platform to help them deliver ever evolving and stable cloud data warehouses. Customers love the fact that they can do most of their work in a single environment that just works. A full array of functionality allows them to move towards a truly agile development & operation process. Does it work? Our customers enthusiastically say ‘yes!’. Some of them are now able to make up to 250 deployments per months while dramatically reducing the number of errors.

    Zero hero

    And best of all: the reliance on the MacGuyvers on your team – those smart people who can’t ever go on vacation because the stability of the processes is reliant on their domain knowledge has greatly been reduced. And what do the MacGuyvers think about this? They love it! No more wake-up calls in the middle of the night or the weekend when workflows fail. Instead, they can focus on what they do best: engineer and deliver great data products to their stakeholders. We call this the ‘Zero Hero’ approach.

    Agile Data Engine: A powerful & single platform

    Are you McGuyvering your cloud data warehouse? More about Agile Data Engine and what we do in later blog posts.

  • Ice Bathing Quantified

    Ice Bathing Quantified

    Shock!

    “OMG, OMG” – The discomfort I experienced was almost unbearable. My entire body was begging me to get out of the cold swimming pool on a dark & rainy afternoon in November of 2021. It was getting difficult to regulate my breathing. Two hotel guests walked by and shook their heads in disbelief that somebody would be in the pool that day. “Just another 30 seconds….”, I was telling myself. Getting out of the water in less than a minute would have felt like surrender. But I managed to activate every bit of willpower and spent 2 minutes and 30s in the 12C water that day. It was my first official ice bath.

    No ice cubes required – a mountain river

    Why?

    Let’s back up for a second – why would I even entertain the idea of jumping into a cold pool? There has been a lot of talk about the benefits of ice bathing recently and a lot of research is starting to go into this area. As an avid endurance athlete, I am always curious to learn new things that can help me perform and recover better. And with that, it was just a matter of time before I decided to give it a try. It is claimed that ice baths not only help you build a stronger immune system but that they also lower stress levels, improve metabolic function and sleep. But research is still in the early stages and you can rather gather all kinds of anecdotes on the internet. All the more surprising since we have a ton of personal devices at our finger tips to test & quantify some of the claims. Wearable companies like Oura, Whoop & Garmin provide neat algorithms and features that should be able to shed some light. And I set out to do just that.

    After the ice bath

    Following that painful inaugural bath, I raced back to my hotel room to warm up. The shivering & discomfort continued for a few minutes. Once that had subsided, an incredible sense of calmness began spreading through my body. It was a strange sensation. Indeed, a look at my Garmin watch revealed that my resting heart rate had dropped to under 40 beats per minute. That was a huge surprise as I had done a very hard 100km bike ride earlier in the day. After these kinds of efforts, my heart rate typically stays elevated for many hours. And this sense of calmness continued for a few hours. But do wearables like Garmin & Whoop register this?

    Quantifying the benefits

    There are two tools specifically that come in handy: Garmin’s Body Battery & stress algorithms and Whoop’s Stress Monitor. I won’t go into details of this – the names are pretty self explanatory. So what do the algorithms say? Here is a typical response. After an initial shock of getting into the cold water, stress levels go down and the body battery recharges. Whoop records a similar reduction in stress even during the actual ice bath:

    You can see stress levels decrease around 14:30h and the Body Battery % increase
    Whoop measures a significant drop in stress levels during the ice bath

    Implications

    Does an ice bath solicit this type of response all the time? Surprisingly, in 80% of the cases it does. Below are some further examples. There are days where the effects are more pronounced than on others. The same is true for the subjective positive feeling in the hours after. But what about the long term effect? Most wearables measure heart rate variability (HRV) which is an important indicator of your general well-being. The higher the value, the better. Over the past two years, my average HRV has increased by 10%. Can I tie this back to ice baths? No, I can’t. There are just too many variables I have worked on. I do think though that it plays a role.

    The Elephant in the Room

    Again, why ice baths? The benefits seem cool (no pun intended) but the associated discomfort must offset that? The surprising thing is, that your body adapts very quickly. After just 5-10 sessions, it gets a lot easier. And about 1 month in, I started to tremendously enjoy it. There is no pain anymore. It just feels really really good. You have got to experience it to believe it. And as an added benefit, it keeps my Garmin & Whoop data looking good!

  • What is the OSIsoft PI System?

    What is the OSIsoft PI System?

    The OSIsoft PI System

    In the last two blog posts, I spoke about Industry 4.0 and the challenges around working with industrial sensor data. Let me attempt to quickyl summarize the outlined problems: Industry 4.0 initiatives require a ton of time-series data. Acquiring, managing and analyzing this can be extremely challenging.

    This is where the OSIsoft PI System comes into play. It’s been around for almost 35 years and has helped thousands of operations & IT professional manage their industrial sensor data. Today, I want to provide a high-level overview of PI for those people who are new to Industry 4.0 and the sensor data analytics space. (Please take a few minutes to read the prior blog post for a description of the basic business problems).

    It’s a data jungle

    As discussed in the last blog entry, most organizations have massive struggles with capturing and managing data from their assets. If you happen to work in such an environment, you will know this scene:

    System Architecture
    Spaghetti diagram galore: how does the sensor data get to people and applications?

    The OSIsoft PI System is all about simplifying this picture. It takes care of the full process for acquiring, archiving, managing and analyzing massive amounts of sensor data. Think of the PI System as a tool that takes care of getting data from the sensors to the users and applications that need it. This is basically a three step process:

    The OSIsoft PI System

    Data capture/ Collect

    It starts with collecting data. As outlined before, this can be quite difficult. The PI System therefore offers a library of 450+ interfaces for virtually any kind of industrial communication standard or specific assets. There is no custom coding and no sherlock-holmesing of ancient APIs. This not only saves a tremendous amount of time but also significantly lowers risk (bad data, etc.). Further, the interfaces are smart: there is essential stuff like data buffering, filtering of bad data, etc.. along with auto-discovery of data sources. This ensures clean and reliable data.

    PI Interfaces
    Got an old asset? No need to worry about custom coding. There are 450+ standard PI interfaces.

    Arrival in the OSIsoft PI System

    OSIsoft PI System

    Once the data has been collected, it needs to be stored & prepared for analysis. This is a big job that most databases are not made for. Keep in mind: Industrial sensor data is fast. 1-100hz data are not unusual and asset operators require timely information (i.e. NOW). The PI System stores the data immediately upon arrival and provides it to the users or applications in real-time. Yes, it’s a real-time system and that’s why you see PI in so many control centers around the globe. But just providing data in real-time would not be enough to satisfy the requirements of Industry 4.0. The PI System therefore does some really cool stuff such as calculations (simple KPIs and very complex mathematical formulas), unit of measure conversions, tagging of events, sending notifications etc…..

    In case you want to perform historical analysis, you can also query data from 10-20 years ago in mere seconds. All data is hot and available – no more complicated archiving and waiting. This is cool stuff – think about the massive data volumes that we are dealing with here. The OSIsoft PI System does all this without any complaints – it is optimized to provide industry strength performance and reliability.

    sensor data volumes
    Data volumes in the industry can be massive. Source: OSIsoft

    Context

    How do you want to make sense of this much data? Keep in mind that sensor stream naming conventions are weird and funky (e.g. TI37.109-CP-TK9PV). A white paper by OSIsoft sums up this problem:

    Typically, only a few initial users responsible for control system naming convention can fully benefit from the value built into the semantic namespace. Others spend valuable time trying to find and integrate the “right” operational data for analysis, roll ups. As a result, operational data often remain “dark” –untouched, underutilized or forgotten.

    What if we could attach those weird technical names to a metadata model (like a hierarchy)? That’s exactly what the PI System does: Tag names are attached to real-world assets such as transformers, pumps & reactors. You can then navigate the tremendous amount of data through a business view and you can also create asset templates for easy system configuration. Each template can not only contain standards such as calculations, units of measure & other useful stuff (read this case study for a nice example). In effect, working with the data has suddenly become a whole lot easier. Comparing one pump with another is possible just like standardizing the sensor data models across equal assets. This is very powerful stuff in a world that drowns in data but is starving for information.

    Sensor data context
    Notice the difference: The right hand side makes sense. The left hand side is simply confusing.

    Name those events

    Making sense of big data requires automated structuring of it. This is especially true for sensor data. In an industrial environment, we are always interested in analyzing specific events such as batch durations, start-ups, downtimes, etc.. These periods of time contain stories and insights that help you to improve processes. But they are notoriously difficult to find and compare when left unstructured. The OSIsoft PI System automatically bookmarking these events. You can then easily compare various batches or simply analyze what led to a downtime. This is really powerful stuff.

    OSIsoft PI Event Frames

    The last mile

    Now we have captured, archived and prepard that sensor data. But data is only useful if you really use it. That requires the timely and effective delivery to users and business applications. Rest assured that the OSIsoft PI System knows how to do that as well. It starts with real-time visualization clients, it includes a powerful SDK and also a really neat BIG Data integration tool. Discussing this in detail would be too much for this post, however.

    PI Coresight

    Big Data & Industry 4.0

    To summarize this longer than usual post: The OSIsoft PI System is your best friend when it comes to managing sensor data. Relational databases are not made for this type of data.

    Without an appropriate data infrastructure, Industry 4.0/ Digitalization efforts can quickly come to a grinding and frustrating halt. Does it require a lot get this up and running? No. Installations are usually fairly quick (we are taking days not weeks) and the hardware requirements are also nothing to worry about (it runs on my laptop).

    As always, thanks for reading and sharing!

  • Industry 4.0 and the sensor data analytics problem

    Industry 4.0 and the sensor data analytics problem

    That sensor data problem

    A few weeks ago, I met with a number of IT consultants who had been hired to provide data science knowledge for an Industry 4.0 project at a large German industrial company. The day I saw them they looked frazzled and frustrated. At the beginning of our meeting they spoke about the source of their frustration: ‘Grabbing a bunch of sensor data’ from a turbine had turned out to be a pretty daunting task. It had looked so simple on the surface. But it wasn’t.

    Industrial time series data

    Data hungry Industry 4.0

    In my last blog post, I looked at the Industry 4.0 movement. It’s an exciting and worthy cause but it requires a ton of data if executed well. Sensor data (aka industrial time-series data) from various assets and control systems is key. But acquiring this type of data, processing it in real-time, archiving and managing it for further analysis turns out to be extremely problematic if you use the wrong tools. So, what’s so difficult? Here are the common problems people encounter.

    1. The asset jungle

    When we look at a typical industrial environment such as a packaging line, a transmission network or a chemical plant, we will find a plethora of equipment from different manufacturers, assets of different ages (it’s not unusual for industrial equipment to operate for decades), control and automation systems from different vendors (E.g. Rockwell, Emerson, Siemens, etc.). To make things worse, there is also a multitude of different communication standards and protocols such as OPC DA, IEEE C37.118 & Modbus just to name a few. As a result, it’s not easy to communicate with industrial equipment. There is no single standard. Instead, you typically need to develop and operate a multitude of interfaces. Just ‘grabbing’ a bunch of sensor data suddenly turned difficult. There is no one-size fits all.
    Asset Jungle
     

    2. Speedy data

    Once you have started communicating with an asset, you will find that its data can be quite fast. It’s not unusual for an asset to send data in the milisecond or second range. Capturing and processing something this fast requires special technology. Also, we do want to capture data at this resolution as it could potentially provide critical insights. And how about analyzing and monitoring that data in real-time? This is often a requirement for Industry 4.0 scenarios.
    high speed data
    High speed data vs slow: what could you be missing?

    3. Big data volumes

    Not only is data super fast, it’s also big. Modern assets can easily send around 500 -10000 distinct signals or tags (e.g. bearing vibration, temperature, etc.). A modern wind turbine has 1000 plus important signals. A complex packaging machine  for the pharmaceutical industry captures 300-1000 signals.
    The sheer volume creates a number of problems:
    • Storage: Think about the volume of data that is being generated in a day, week or month: 10k signals per second can easily grow to a significant amount of data. Storing this in a relational database can be very tricky and slow. You are looking at massive amounts of TB.
    • Context: Sensors usually have a signal/ tag name that can be quite confusing. The local engineer might know the context, but what about the data scientist? How would she know that tag AC03.Air_Flow is related to turbine A in Italy and not pump B in Denmark?

    sensor structure
    Signal/ tag names can be extremely confusing

    4. Tricky time-series

    Last but not least, managing and analyzing industrial time series data is not that easy. Performing time-based calculations such as averages require specific functions that are not readily available in common tools such as Hadoop, SQL Server and Excel.  To make things worse, units of measure are also tricky when it comes to industrial data. This can especially be a huge problems when you work across different regions (think about degree C vs F). You really have to make sure that you are comparing apples to apples.

    5. Analytics ready data

    An often overlooked problem is that sensor data is not necessarily clean. Data is usually sent at uneven points in time. There might be a sensor failure or a value just doesn’t change very often. As a result you always end up with unevenly spaced data which is really hard to manage in a relational database (just google the problem). Data scientists usually require equidistant data for their analytics projects. Getting the data in the right shape can be immensely time-consuming (think about interpolations etc.).

    Uneven Time-Series data
    Unevenly spaced sensor data

    That tricky sensor data

    To summarize this: ‘grabbing a bunch of sensor data’ is anything but easy. Industry 4.0 initiatives require a solid data foundation as discussed in my last post. Without it you run the risk of wasting a ton of time & resources. Also, chances are that the results will be disappointing. Imagine a data scientist attempting to train a predictive maintenance model with just a small set of noisy and incomplete data.
    To do this properly, you need special tools such as the OSIsoft PI System. The PI System provides a unique real-time data infrastructure for all your Industry 4.0 projects. In my next post, I will describe how this works.
    What are your experiences with industrial time-series data?
  • Industry 4.0 & Big Data

    Industry 4.0 & Big Data

    Industry 4.0

    If you work in a manufacturing related industry, it’s difficult to escape the ideas and concepts of Industry 4.0. A brainchild of the German government, Industry 4.0 is a framework that is intended to revolutionize the manufacturing world. Similar to what the steam engine did for us earlier in the last century, smart usage of modern technology will allow manufacturers to significantly increase effectiveness.
     
    While there is a general framework that describes what Industry 4.0 should be, I have noticed that most companies have developed their own definitions. As a matter of fact, most of my clients lump the terms Industry 4.0, Digitalization and IoT together. Also, the desired objectives have a wide range and include items such as:
    • Improve product quality
    • Lower cost
    • Reduce cycle time
    • Improve margins
    • Increase revenue
    Industry 4.0 initiatives

    Industry 4.0 initiatives

    With a wide definition of Industry 4.0/ Digitalization comes an equally wide interpretation of what type of tactics and initiatives should be undertaken to achieve the desired outcomes. Based on my own experience, I see companies look at a variety of activities that include:

    When you think about it, each one of these programs requires a ton of data. How else would you go about it? Consider the easiest example: energy management. Reducing the amount of money spent on energy throughout a large plant by gut-feel or experience is almost impossible. It is the smart use of data that allows you to identify energy usage patterns, and hot spots of consumption. Data must therefore be the foundation of every Industry 4.0 undertaking.

    Big Data & Industry 4.0

    What type of data does Industry 4.0 require? It depends. Typical scenarios could include relational data about industrial equipment (such as maintenance intervals, critical component descriptions etc.), geospatial (e.g. Equipment location, routes, etc.) and most importantly sensor data (e.g. Temperatures, pressure, flow-rates, vibration etc.).
    geospatial information
    Sensor data enriched with geospatial information
    Sensors and automation systems are the heart of your Industry 4.0 program: they pump a vast amount of highly critical time series data through your various initiatives. Just like the vital signals from a human being allow a doctor to diagnose a disease, industrial time series data allows us to learn more about our operations and to diagnose problems with our assets & processes early on.
    Screen Shot 2016-07-12 at 21.38.49

    The value of industrial time series data

    Assets such as turbines, reactors, tablet presses, pumps or trains are complex things. Each one of them has thousands of valves, screws, pipes etc.. Instead of relying on intuition, hard-earned experience and luck, we can collect data about their status through sensors. It’s not unusual for specific assets to produce upwards of 1000-5000 signals. Combine a number of assets for a specific production process and you end up with some really BIG DATA. This data, however, allows engineers and data scientists to monitor operations in real-time, to detect specific patterns, to learn new insights and to ultimately increase the effectiveness of their operations.

    screen568x568

    What’s next?

    Industry 4.0/ Digitalization is an exciting opportunity for most companies. While many organizations have already done a bunch of stuff in the past, the hype around Industry 4.0 allows project teams to secure funds for value-add initiatives. It surely is an exciting time for that reason.
     
    But is dealing with industrial time series data easy? Collecting, archiving and managing this type of data can be a huge problem if not done properly. In the next blog post, I will speak about the common challenges and ideas for making this easier.
  • The Big Data Challenge of Activity Trackers

    The activity tracker revolution

    Activity trackers such as the ubiquitous Fitbit, Jawbone and the Garmin Vivofit are extremely popular these days. You can frequently spot them on colleagues, friends and customers. Their popularity raises a question: Does the collected data add value to your personal life? As a data hungry endurance athlete who relies on various technologies such as heart rate monitors, accelerometers & powermeters to improve my training I could not resist finding the answer. For the past three months I have worn a Garmin Vivofit to collect and analyze data. Here are my experiences and a simple process for getting value out of your activity tracker.

    The Data

    What do activity trackers actually do? The devices count the number of steps that you take each day (they also estimate the distance you have covered). In addition, they also track data about your sleep. The Garmin Vivofit and the Polar Loop also allow you to measure your heart rate and the associated calories burned during workouts. Pretty basic stuff really, nothing too fancy. Once the data has been collected you can review it in an app. The reports are very easy to understand, but it’s easy to brush over them. As a matter of fact, many people I know don’t use the dashboards. Instead, they simply look at their total step number. I believe that you can do more. Last year I wrote a very popular post called “Data is only useful if you use it!“. The activity tracker is a prime example. Here is the process that I leverage.

    The Garmin Vivofit Dashboard
    The Garmin Vivofit Dashboard

    Five easy steps

    1. Collect a bunch of data.

    Start using your activity tracker for a few weeks. Make sure to wear it every single day. Wear it all the time. Synchronize frequently to avoid losing data. Also, make sure to familiarize yourself with the reports that are available for your device.

    2. Analyze your lifestyle.

    Once you have collected data, spend some time to look at the reports. I discovered a few surprises:

    • Reaching the typical goal of 10k steps per days is not that hard for me. A typical morning run can easily get me above to 10000 steps before 8am.
    • A typical workday is a bit of a shocker: Conference calls, admin work and email create long periods of complete inactivity except for the occasional walk to the coffee machine or the bathroom. As a matter of fact, the morning runs often account for 80% of the activity for the entire day.
    • Weekends and vacation days usually show a high activity level. I typically move around a lot and it is spread evenly throughout the day.
    • No wonder that conferences and trade-shows are so exhausting: the five most active days (as measured in steps) are linked to conferences. You constantly move, hardly ever sit around and often walk long distances.

    Check out the charts below. Pretty interesting stuff.

    Vivofit Report
    A typical workday: Run in the morning and then a lot of nothing. Not good!
    Vivofit Report
    Vacation day – constant movement

    3. Identify weak spots.

    Now that you have found some interesting patterns, identify your weak spots. I found three specific areas:

    • Not enough sleep
    • Too many periods of complete inactivity during working hours
    • Hardly any activity on workdays when I don’t work out (steps below 5000)

    It’s fairly easy to get this information out of the reports.

    4. Make changes to your lifestyle

    It’s time to make some changes. In general, scientists recommend to stay active throughout the day to keep your metabolism engaged. And some of the activity trackers can help you with that. My Garmin Vivofit, for example, features a red bar on top of the display which displays inactivity. To clear this bar you basically have to move and do something.

    Sitting on a plane...
    Sitting on a plane…

    In general, here are some of the things that I have changed:

    • Instead of taking mental breaks at my desk (surfing, reading the news, personal email), I now get up every 45-60 minutes and spend a few minutes doing an activity (walking, push-ups, stretching).
    • 3-4 short walks on rest days. It’s good to get out!
    • Focus on sleep

    5. Use the activity tracker for daily motivation

    Once you have some goals and objectives, you can also use the activity tracker to get motivated. First of all, there is the daily goal that all of these devices provide you with. Then some of them also have badges for certain achievements. It’d kind of fun to work on getting them. Last but not least, you can also participate in step challenges with friends and families.

    Garmin Vivofit Badges
    Collecting badges can be fun

    Summary

    Activity trackers can definitely provide you with some interesting insights. However, you do have to make an effort to analyze the data. Simply looking at the total number of steps is probably a waste of money. To do that you can purchase a cheap step tracker. It’s the analysis where you get the bang for the buck. Will I continue wearing the Garmin Vivofit? I certainly will. I am currently in the process of assessing how activity levels between really hard workouts affect my recovery. What are your experiences?

  • Keep natural gas flowing with analytics

    The Power of Data

    Last week, I had the honor to moderate the OSIsoft 2014 user conference in San Francisco. Over 2000 professionals came together to discuss the value and use of real-time data across different industries. There were a ton of really interesting and inspiring customer presentations. It’s just amazing to see how much companies rely on analytics these days to keep their operations running and/ or to improve their situation.

    Combating the Polar Vortex

    One of the keynote presentations of the conference really stuck out and I want to share the content with you. Columbia Pipeline Group (CPG) operate close to 16000 miles of natural gas pipelines in the US. Keeping the gas flowing reliably and safely is not easy to begin with. But doing that during the polar vortex that struck the East Cost of the US earlier this year is even harder. CPG turned to real-time data and analytics to keep their assets safe. The benefits of using data are tremendous as outlined in Emily Rawlings’ presentation:

    • Estimated $ 2.8M in savings from event (outages etc.) prevention
    • Increased customer confidence
    • Improved asset reliability
    • Expanded operational visibility.

    If you have a few minutes to spare, take a look at Emily’s cool presentation:

  • The Power of Data

    The Power of Data

    Real-time data is all around us. Modern sensors allow us to capture enormous amounts of data at extremely high frequencies. Here is an example: grid operators nowadays utilize so-called syncrophasors (also called PMUs) to record over 40 different KPIs at 120hz. They use this information to keep our electric supply safe and stable. Shift managers use real-time data to keep production lines running and performing. However, managing this type of data requires a different type of technology. It’s not your typical big data problem. You can’t just stick this high-speed stuff into a simple relational database. That would be like driving around the desert with a Formula 1 car.

    grid stability
    Monitoring grid stability in real-time

    OSIsoft

    My new employer OSIsoft has been helping companies capture, archive and analyze real-time data for over 30 years. It’s quite an amazing success story. It all started with a brilliant idea to develop a high performance time-series database (the famous PI system). This has gradually developed into a true infrastructure for managing all kinds of real-time data across different industries. If you want to find out more about this, take a few minutes to watch the recent keynote from our EMEA User Conference 2013 in Paris. If you want to skip my opening words, you can safely forward to minute 10.

    Enjoy!

  • Data is only useful if you use it!

    The value factor

    We have all become data collectors. This is true for corporations and individuals. Organizations store petabytes worth of customer transactions, social sentiment and machine data. SAP’s Timo Elliott recently wrote a nice blog post about the ‘datafication’ of our own private lives. Just to give you a personal example, I have over 2GB worth of exercise data (heart rate, running pace, cycling power, GPS info, etc.) ranging back to 2003. But there is a growing problem – too many people & organizations are just really good at collecting data. Not enough people are doing anything with it. Let’s face it – data is only valuable if we really use it!

    The inertia problem

    strava
    There is a ton of data available

    Leveraging data for your benefit can be a struggle: you have to process it, you have to look at it, you have to analyze it and you also have to think about it. Here is an example: let’s say I am a runner and I wear a heart rate monitor that is connected to my iPhone. I will only get value out of that data, if I am willing and qualified to analyze it after each run. Letting the data sit on my iPhone will not help me identify trends and patterns. And then there is also the step of developing and implementing specific actions: should I rest, do I need to run harder to improve my marathon time or do I actually need to slow down to accelerate recovery? The same thing is happening in organizations. Starting to trust your analytics is another whole big issue.

    Take action

    How can we prevent becoming masters in data collecting but rather champions in performing analytics? Based on my experience there are a number of actions we should all look at (personal & professional):

    • Examine your available data and make sure that you really understand what it all means. This includes knowledge of the data sources, meaning of KPIs, collection methods, etc..
    Power data
    Do you really understand your data?
    • Sit down and clearly identify why you are collecting that data. Identify goals such as increase sales, set a PR in the next marathon, increase machine performance.
    • Develop a habit of working with your data on a daily basis – practice makes perfect. Only cont
    • Acquire the right skills (attend training, read a book, meet a thought-leader etc.) – we all need to work on our skills
    • Invest in the right tools – not every piece of software makes it easy to perform analysis.
    • Collaborate with other people, i.e. share your data, discuss findings
    • Celebrate success when you are able to achieve your desired outcomes

    What are your experiences? Are you really leveraging your data or are you just collecting it? What else can we do?

  • See you at the OSIsoft EMEA User Conference 2013

    OSIsoft EMEA UC

    Please allow me to do some advertising for my company today. Beginning this year, OSIsoft will host an annual Pan-EMEA Users Conference event to bring together the latest PI System information coupled with presentations from customers that demonstrate the business value they have achieved using the PI System.The user conference will take place in Paris from September 16th – 19th.

    Why attend?

    This event is the ideal place for existing users and prospective customers to share and learn more about the PI System and how it drives value in their businesses. It’s a great opportunity to network with industry peers as well as OSIsoft developers and executives. I personally love going to these type of events (even when I’m not presenting). It’s the easiest way to pick up a tremendous amount of knowledge within a very short period of time. And let’s face it – it’s fun as well.

    What is OSIsoft PI?

    Some of you might not know what the PI system does. Well, I will write about that in a few weeks from now. To keep it short and simple: The PI system allows you to collect, archive & analyze massive amounts of real-time data (we are talking milliseconds) generated by machines and sensors. Smart Grid & wind park operators, manufacturers and many others have been using the PI system for close to 32 years to make sense of all their machine signals. It’s fascinating stuff.

    Click here to find out more about the OSIsoft EMEA user conference.