Blog

  • Contribute to the “2012 Wisdom of Crowds BI Market Study”

    Dear readers of this blog,

    I’d like to personally encourage you to contribute to Howard Dresner’s annual Wisdom of Crowds Business Intelligence Market Study. Howard is a veteran of the BI industry and his studies provide valuable insights for all business intelligence professionals. The great news is that all participating customers will receive a complementary copy of the survey findings.

    The survey has 35 questions and should take approximately 15 minutes to complete.  The final report is currently targeted for release in mid-May 2012.

    The online form will remain open until 5PM on April 2nd 2012.

    Wisdom of Crowds Business Intelligence Market Study

  • The Evolution of Social Business Intelligence – Guest Post

    Guest Post

    This mission of this blog is to share ideas about business analytics. One of the things I want to increasingly do this year is to feature more guest bloggers and do more interviews.

    A few months ago, I came across Sanjay Shetty’s unique blog Communities R Us. His approach to blogging about social media topics is very visual. Sanjay and I ended up connecting via a recent blog post where we exchanged a few ideas. The idea of a guest post quickly developed. And here it is: Sanjay Shetty writes about his views on Social Business Intelligence.

    Evolution of Social Business Intelligence: Human Business Intelligence

    Social Media provides a fantastic opportunity for enterprises to gather enormous amount of business intelligence, whether it’s about their customers likes and dislikes, or whether it’s competitive intelligence. My earlier post and video covered quite a bit of ground. However, I’ve seen organizations limiting themselves and the power of the social opportunity in leveraging true human business intelligence.

    (more…)

  • SUCCEED Magazine- An article about Business Analytics

    SUCCEED Magazine

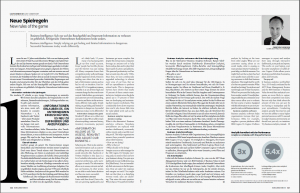
    About six months ago, I had the honor to write a short article for the business magazine SUCCEED which is distributed via Austrian Airlines. Succeed is actually one of the frequent flier magazines that I love reading. There is a ton of valuable business content in there. The purpose of the bilingual post (German & English) was to explain what Business Analytics is all about. (There is a download link at the bottom of this post)

    New Rules of the Game – English version

    Business intelligence: Simply relying on gut feeling and limited information is dangerous. Successful businesses today work differently.

    Christoph PapenfussThink back 15 years ago: many of us had just gotten our first email account. Fewer people had mobile phones and the internet was just taking off. Many companies knew their competition pretty well and change usually happened slowly. Decision making was often slow due to a lack of information systems and we had to rely on intuition. Fast forward to 2011: Competition is intense, volatility is at an all-time high and constant change has become the new normal. Stakeholders, governments and customers are more demanding. To survive and thrive in this environment, different rules apply. Simply relying on gut feeling and limited information is dangerous. Successful businesses today work differently!

    Information changes the game

    (more…)

  • Visualize This! A book review

    Visualize this!

    Visualization of data is one of the hottest topics these days. No matter where I go, people are taking a huge interest in it. Infographics are floating the Internet, for example. Companies are looking to refine their dashboards with better visuals. This was also apparent at the Gartner BI Summit earlier this week.

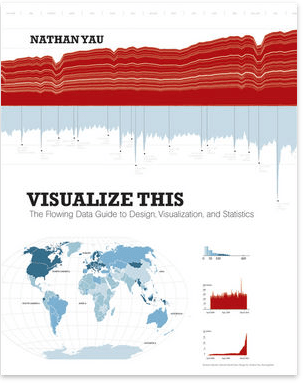
    Despite the tremendous attention, there are only a few good books about this topic in the market. One of them is Nathan Yau’s title Visualize This: The FlowingData Guide to Design, Visualization, and Statistics. This week, I was able to finally read it all the way through. Did I enjoy reading it? Yes and no.

    visualize this

    Great concepts

    Yau does a fine job with engaging the reader in the first part of the book. He explains a number of important fundamentals of visualization. This includes a process that he suggests people should follow:

    1. Get your data
    2. Ask a question (what do you want to know about it?)
    3. Choose your visualization tools
    4. Explore the data (look for trends, patterns, differences, etc.)
    5. Tell the story and design the visual

    There is a lot of relevant information for business analytics professionals in this section. I particularly like that Yau urges his readers to clearly figure out what story they want to tell by visualizing data. This is often forgotten in the design of a dashboard (e.g. do I use a line-chart to show the trend, or do I use a bar chart to show the variances?)

    “Approach visualization as if you were telling a story. What kind of story are you trying to tell? Is it a report, or is it a novel? Do you want to convince people that action is necessary?” Nathan Yau

    The other chapters

    The remaining chapters of the book contain valuable content as well. The author covers topics such as handling data and picking tools for building charts. Several chapters are dedicated towards describing how to best visualize certain problems (e.g. patterns, proportions, spatial relationships, etc.). Each section provides plenty of examples and some good ideas. I enjoyed working through this. But I do have to say that the content isn’t nearly as deep as let’s say Stephen Few’s material.

    A good book for BI professionals?

    So far so good. There is just one thing that you should know: Many chapters are also full of technical instructions that teach you how to build graphs and charts in the open source package R along with Adobe Illustrator. There is a lot of code in the book. Technical folks might enjoy this. But it is not my cup of tea and most BI professionals will hopefully build their charts using the corporate BI platform. To be honest, I went ahead and skipped those pages.

    Visualize this!

    Nathan Yau’s book Visualize this! is definitely a good book. I learned a few things here and there and took ample notes. It is also entertaining.  However, one has to understand that this is not necessarily a book dedicated towards BI professionals. Rather, this is a book for people who are looking to build infographics and other standalone visualizations. Nevertheless, you can tell that Nathan Yau is passionate about it and he inspired me to hone my skills. If you are looking for a deeper and more business oriented read, I would rather recommend the books by Stephen Few and Edward Tufte.

  • The Gartner BI Summit 2012 – A great event

    Gartner BI Summit 2012

    Wow. I cannot believe it. The Gartner BI Summit 2012 is already over. The event raced by like a bullet train at full speed. Time flies when you are having fun. Last Wednesday, I sat down with the conference agenda and developed a nice plan. I had grand visions of collecting lot’s of information and creating several posts for this blog. But things turned out differently……wait a second. Let’s back up.

    Uncertain times

    One of the recurring themes at the conference was uncertainty. Ironically, that uncertainty applied to the event as well. 2cm of snow created massive problems at Heathrow. Many attendees got stuck and arrived late. Two flight cancelations and another major delay did not prevent me from arriving right in time to see the BI Excellence Award finalists present their case. But I did miss the Gartner keynote which was supposedly outstanding.

    Gartner BI Excellence Award

    Gartner BI Summit 2012
    Our session was packed. I really enjoyed showing IBM's latest technology

    One of the true highlights of the Gartner BI Summit were the presentations by the three BI Excellence Award finalists. This was really exciting for me as a member of the global IBM Business Analytics team: two of the 2012 finalists are IBM customers. Spanish insurance giant MAPFRE presented an awesome case. They have standardized on IBM Cognos 10 and developed a rock-solid global BI standard with massive ROI. Marcos Garcia March delivered a stunning presentation of their case. He was followed by the winner: Medway Youth Trust. This is a 2M GBP foundation focusing on helping kids avoid unemployment. The CEO demonstrated a highly innovative use case for predictive analytics (using SPSS). Counselors log conversations with kids to detect patterns that can help them not only better identify kids at risk but to also fine-tune their strategies in dealing with them. The audience was impressed. London Transport was the final case. They use Business Intelligence to better guide and observe traffic in London.

    Congrats to Medway Youth Trust for their win. Also, congrats to Mapfre and London Transport. Awesome achievements! Make sure to read the Medway Youth Trust case study.

    Random Observations

    Here are a few brief observations. I actually ended up having a lot of customer meetings and did not have time to attend too many session:

    • Technology has come a long way. There are so many cool and amazing solutions out there. But many organizations are still struggling with basic things like user adoption, missing analytical skills, data quality, design of driver-based plans and such. We cannot afford to ignore these issues. Technology alone won’t fix them for us.
    • It’s all about decision making. Never before have people put so much emphasize on the idea that business analytics must help organizations make better business decisions.
    • More and more people speak about Business Analytics. I suspect that the term BI will gradually disappear over the next few year. Most vendors including IBM and also Gartner now exclusively speak about Business Analytics.
    • Predictive analytics is hot. The relevant sessions that I attended were packed. And the interest is also evidenced by Medway’s win. I did sense, though, that most organizations are still trying to figure out how to embed and use predictive capabilities. It’ll be interesting to watch the progress next year.
    • Big data is getting bigger. There is a lot of buzz around this topic. Is this warranted? Many organizations are still struggling with basic issues. Is there too much focus on advanced topics? Shouldn’t we spend an equal amount of time on fixing the foundation first?
    • The customers that I met with have made amazing progress in the past few years. I do think that we are at an inflection point for business analytics.

    Gartner BI Summit 2012

    The Gartner BI Summit was a great success. Great discussions, interesting sessions and lot’s of positive energy. Looking forward to next year in Barcelona!

    Useful links:

  • See you at the Gartner BI Summit next week

    Gartner BI Summit

    Time flies when you are having fun. I just realized that the Gartner EMEA BI Summit is just around the corner. It is scheduled to kick off in London next Monday, February 6th. The Gartner BI Summits are always a true highlight. I love the focus of the event, the variety of high quality presentations and most importantly the discussions between all delegates. London calling!

    Noteworthy Activities

    IBM is once again a premier sponsor of the event. Make sure to stop by our booth. You will be able to see some cool demos of Cognos 10, Cognos Consumer Insight for Social Media, the Cognos iPad solution and many other things. I will try to spend as much time at the booth as possible. Please drop me a note, if you want to meet for a cup of coffee.

    Here are some noteworthy sessions from the IBM side:

    Monday, February 6th:

    11:15 – 12:00: Panel discussion. This is always a highlight. Eric Yau, IBM’s VP for BI and Performance Management will participate this year.

    16:30 – 17:00: IBM Business Analytics Session. Harriet Fryman and I will show some cool new stuff in this session.

    Stay tuned for some updates from London next week.

    P.S.: Watch this video for a quick preview of what Harriet and I will present next week.


  • Stacked bar charts? Mixed feelings!

    Stacked Bar Charts

    Part-to-whole analysis is a common task in business. Let’s say we want to analyze how much different product groups contribute towards total revenue. Or we want to analyze our cost across different cost element groups. One way to do this visually is to leverage waterfall or pareto charts. Another popular option is to use stacked bar charts. Stacked bar charts are just a special type of bar chart. Instead of spreading the different categories out across the x or y axis, we stack them. But are they really useful? I have mixed feelings about them.

    Single Stacked Bar Charts

    Below is an example of a stacked bar chart. This provides an overview of the cost structure for a certain fiscal quarter. You can see that each stack in the chart represents a specific cost element group. The entire stack indicates the total cost.
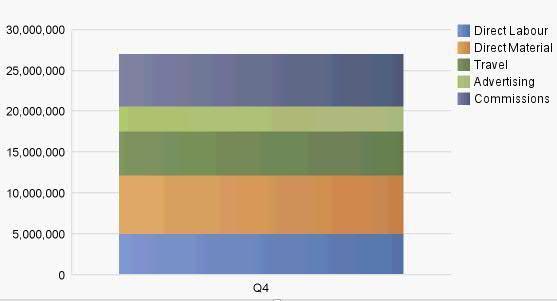
    Is this a good chart? Sort of. Notice how much effort is involved in reading the graph. Comparing the individual stacks requires effort (look at Commissions and Travel, for example). I also find it hard to read the specific values of each stack (how much was spent on advertising?).  On the positive side, this chart allows me to quickly identify the total cost. And I obtain a somewhat solid overview of how the money was spent. However, most business analytics platforms like Cognos 10 allow you to hover over a chart section to see the individual values. That makes the stacked bar chart above somewhat more useful.

    Another way to display this – and I prefer this option – is to use a regular bar chart. Take a look:
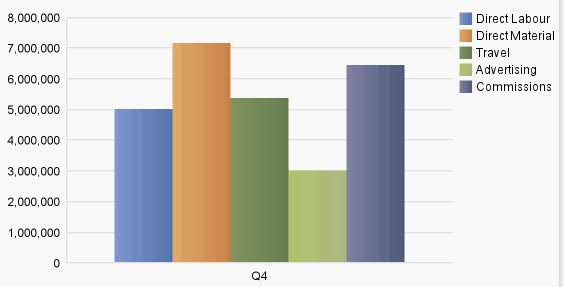
    Bar Chart CognosNotice that the comparison of the different cost categories is a lot easier. You can quickly read the individual values and the comparison between the cost elements is easy as well. But I am missing the total of my cost. We would either have to calculate that or include the information in a different manner. The stacked bar chart therefore does not really impress me in this type of setting.

    Multiple Instances

    So, should we toss those stacked bar charts then? Not necessarily. Take a look the next example. The analysis is now extended to the entire fiscal year. There are multiple instances of the stacked bar chart.

    Stacked Bar Charts Cognos

    Notice how different this looks. You can quickly see that total cost have increased in the last quarter (after decreasing slightly). I am also able to see how the different cost elements have changed throughout the fiscal year (look at advertising, for example). The stacked bar chart is now much more useful. I personally like this. But what about the traditional bar chart in this situation? Let’s take a look:

    Multiple Bar Charts

    The graph invites you to compare the cost composition quarter by quarter. The comparison between different quarters is also not difficult. The only problem with this version is that the overall cost are difficult to assess.  Both versions have their strengths and weaknesses.

    Stacked Bar Charts – Summary

    Stacked bar charts are certainly not bad. But as the examples above show, they are stronger in a multi-instance setting. But even then, you need to be careful: stacked bar graphs tend to look strange when you have negative values (give it a try!). The single stack is not that strong as compared to the traditional bar chart. Both offer different insights. And let’s not forget about waterfall and pareto charts as well.

    From an analysis point of view, I would probably want to switch between the different charts. IBM Cognos 10 provide users with the ability to change chart types on the fly. That makes the analysis of data very interactive.

    Have you added stacked bar charts to your toolbox? If yes, make sure to use them in the right circumstances.

    P.S.: I will take a look at stacked area charts in February.

  • Spotlight on Forecast Accuracy

    Forecast accuracy in turbulent times

    Forecast accuracy is one of those measures many finance professionals think and talk about. Turbulent times require companies to produce reliable and solid forecasts. Accuracy is a useful measure that helps finance managers assess the quality of the process (to a certain degree!).

    In late 2011, my good colleagues Mark, David and I conducted a survey amongst 160 UK finance professionals. One of the things we wanted to find out was whether accuracy is being measured at all. And guess what – we were pleasantly surprised to see that the majority of all companies do measure and also communicate accuracy. Only a few organizations face difficulties doing so (they utilize spreadsheets as their main tool).

    Forecast Accuracy Survey

    “We stand very little chance of forecasting successfully unless we measure our performance continuously and correct our forecasts accordingly.”, Steve Morlidge & Steve Player, authors of “Future Ready”

    Accuracy Insights

    About a year ago, I posted a series of articles that focused on forecast accuracy. If you are interested in this topic, I would like to invite you to read and share those entries.

    The basics

    There is a set of posts that cover the basics of this topic. You can find a bunch of examples in there as well.

    Experiences

    Experiences are also important. You can find out what some experts are saying about this topic.

    If you have any experiences with forecast measurement, please leave a comment. As solid as the above mentioned survey results look, experience shows that many finance professionals are looking for more information about this topic.

  • 7 reasons to register for the IBM Innovations in Business Analytics Launch

    The launch….

    Finally! The wait is over! Mark your calendars and register for the March 7th special IBM Business Analytics event. A bunch of really cool & innovative stuff will be revealed. And let me tell you: If you are interested in Business Analytics, you do not want to miss this product launch!

    IBM Launch
    Click on the photo to register

    Over the next few weeks, I will share a few additional infos about this product launch. Unfortunately, (more…)

  • Are CMOs in denial of the new normal? The IBM CMO Study

    The IBM CMO Study

    Last week, I wrote about Dan Zarrella’s book ‘Zarrella’s Hierarchy of Contagiousness‘. The author declares that many marketing professionals often follow fluffy ‘guesswork’ when it comes to social media. The book implies that the marketing profession is struggling with social media. Is that really so? Are professionals maybe in denial of the new normal? Good questions. It seems like many of them might be scrambling, indeed. At least that is the finding of the 2011 IBM CMO study. IBM conducted interviews with 1734 different Chief Marketing Officers (CMOs) from 64 countries. The results are very interesting and I highly encourage you to download and read the study. But let’s focus on the social media aspect today.

    Unprepared?

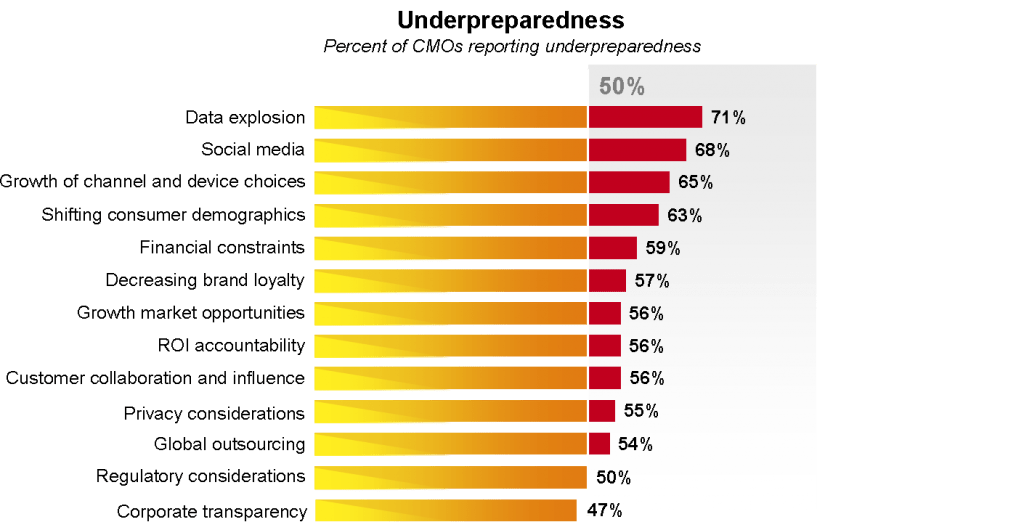
    The IBM CMO Study shows that CMOs share a feeling of unpreparedness. Take a look at the following chart:

    2011 IBM CMO Study
    CMOs are unprepared. Data provided by the 2011 IBM CMO Study

    Interesting! Social media ranks second. However, many of the other factors are related issues (customer collaboration & influence, for example)

    (more…)