WHAT IS VISUAL ANALYTICS – BY DR JOERN KOHLHAMMER
Massive sets of data are collected and stored in many areas today. As the volumes of data available to business people or scientists increase, it becomes harder and harder to use the data effectively. Keeping up to date with the flood of data using standard tools for data management and analysis is far from easy. The field of visual analytics tries to provide people with better and more effective ways to understand and analyze these massive data sets, while helping them to follow up on their findings immediately, in real-time. Visual analytics integrates the analytic capabilities of the computer and the abilities of the human. This means, the human is empowered to take control of the analytical process; he or she is not just the final stage of a reporting process. Visual analytics sheds light on unexpected and hidden insights, which may lead to innovation and increase profits. For example, many key performance indicators are simply calculated using statistical models. But the true relations between data, models and business objectives often remain unclear. If visualization is included as an integral part of the analysis process then comprehension of the models as well as of the data is increased. Errors in the basic assumptions of the models can be recognized early on and newly discovered dependencies in the data can lead to new and possibly better reporting indices.
RESEARCH ACTIVITIES
Since 2004 I have been working in the area of visual analytics and visual business intelligence. Back then I took over a research department at Fraunhofer IGD in Darmstadt. Fraunhofer IGD focuses on applied research in Computer Graphics and was starting to work on additional visualization support for large amounts of data. The topic grew more important each year since then.
In 2005 the University of Konstanz (one of the leading universities in Visual Analytics research in Europe) and my department started to work together to create more funding opportunities in Europe. We also started an official initiative with the US research community on this topic. They had opened a National Visual Analytics Center (NVAC) a couple of years before, under the leadership of Jim Thomas. Their focus was mainly on civil and public security, while the European viewpoint was a bit broader and more business oriented at this stage. We started to push the topic in the EU and a few years later we won a contract to build up the European Visual Analytics community. This project was called “VisMaster” and ended last year. The portal of this project www.vismaster.eu is still up-and-running, and you can find interesting information, news and upcoming events related to visual analytics in Europe on this site.
In parallel to this research side of visual analytics, my department started to work on the possible business applications of VA, especially financial applications and business intelligence solutions. We called the latter “Visual Business Intelligence” (in parallel to similar efforts of Stephen Few in the United States, see www.perceptualedge.com). An article on this topic together with Dr. Carsten Bange from BARC in the IS Report 7+8/2008 on “Visual Business Intelligence” was well received and downloaded many times from the B-Eye-Network (still available here: www.beyenetwork.de/view/9521). We also started a series of Science-meets-Business workshops under the title “Analytics Day” (www.analytics-day.de) bringing together scientific experts in Visual Analytics and various business areas. This series of workshops will most likely be picked up again in 2012.
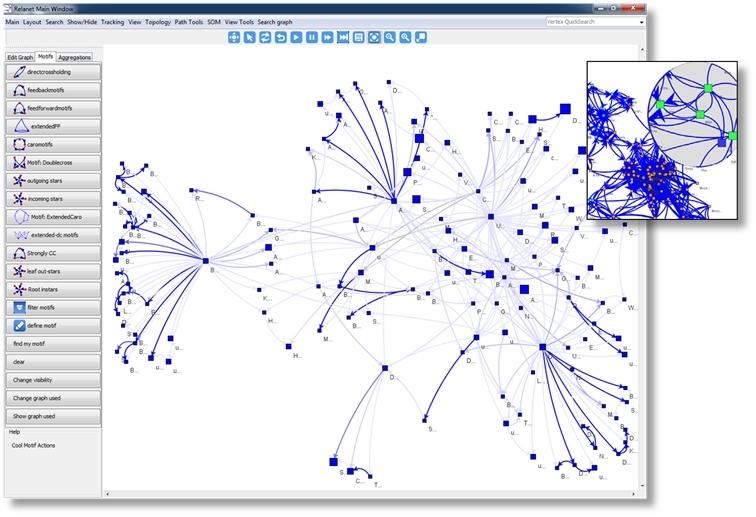
The two images highlight two approaches in this area. The network visualization shows means to interactively analyze large network data, for example company networks, social networks or document networks.
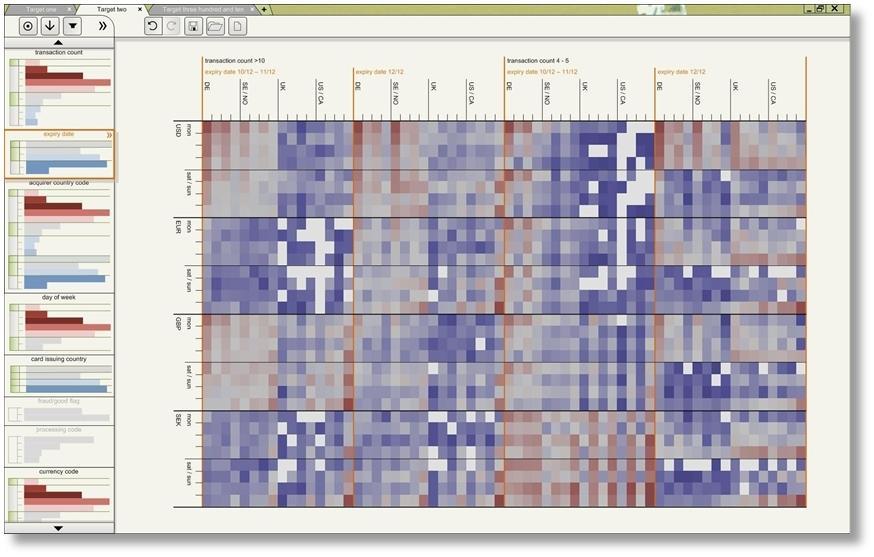
The correlation matrix is used for instance in the field of CRM data analysis to find interesting patterns in vast amounts of information.
I am currently writing a book on “Visual Business Intelligence” with two co-authors from Blueforte, Dirk U. Proff (CEO) and Andreas Wiener. We will cover the topic starting from the history of data visualization over communication models to examples of current practice. We will also give an overview of leading products in this area. It will be the first German language book on this topic with many interesting aspects for BI experts and general BI users. The book will be published in mid-2012.
OUTLOOK
Compared to the start of this topic around 10 years ago and even compared to 2008, when we wrote the article with BARC, visualization and visual analysis support has received increasing attention by practically all vendors of business intelligence tools and systems. Several niche products focus on visual means for BI. They have become quite successful in Europe and the US. At the same time, the leading business intelligence vendors all have a first set of tools for visualization and visual analysis in their portfolio and are interested in extending their portfolio. We are, for instance, currently applying for EU funding together with IBM Haifa and IBM France in this area.
However, this is only the start. Business analytics, advanced analytics, deep analytics and big data are the new topics that drive the industry right now. It is only natural that visual analytics will be the follow-up term to describe enhanced functionality to allow visual insights and interactive, real-time analysis of large amounts of data.
ABOUT JÖRN KOHLHAMMER
Jörn Kohlhammer heads the Department of Information Visualization and Visual Analytics at the Fraunhofer Institute for Computer Graphics (IGD) in Darmstadt, Germany. For five years he worked as a scientist at the Fraunhofer Center for Research in Computer Graphics in Providence, RI, USA in the area of context-based information visualization. His work on decision-centered visualization brought him back to Germany and to Fraunhofer IGD in Darmstadt. He received his doctoral degree from the faculty of computer science at the Technical University of Darmstadt in 2005. His interests include semantics-based and decision-centered information visualization, visual business intelligence, visual analytics, especially their various industry applications


Comments
3 responses to “Visual Analytics – The new frontier? (Guest Post)”
Great post – but who are you?
Ok – sorry! missed the info right in front of me!
Hi Norene – All ok now? Should have put the name up to!