Tag: industry 4.0

  • What is the OSIsoft PI System?

    What is the OSIsoft PI System?

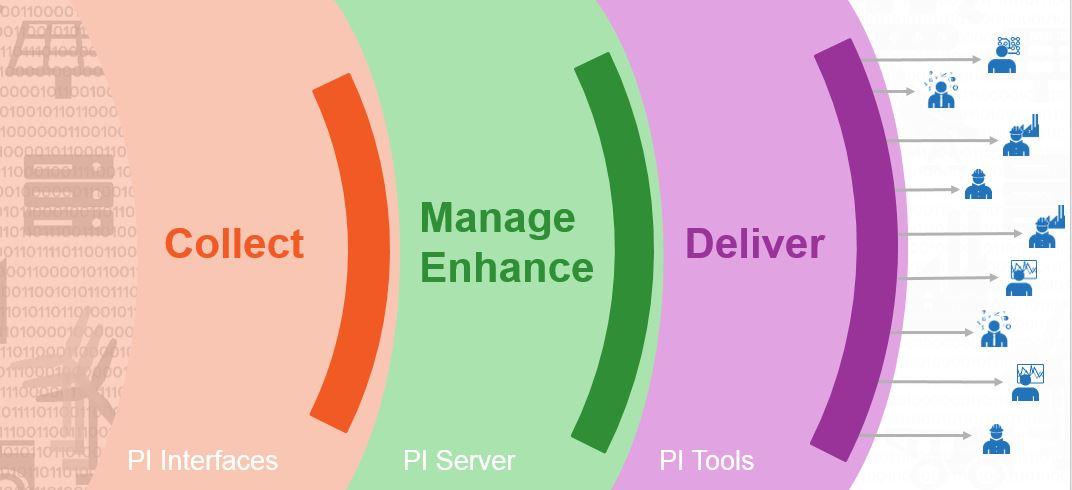
    The OSIsoft PI System

    In the last two blog posts, I spoke about Industry 4.0 and the challenges around working with industrial sensor data. Let me attempt to quickyl summarize the outlined problems: Industry 4.0 initiatives require a ton of time-series data. Acquiring, managing and analyzing this can be extremely challenging.

    This is where the OSIsoft PI System comes into play. It’s been around for almost 35 years and has helped thousands of operations & IT professional manage their industrial sensor data. Today, I want to provide a high-level overview of PI for those people who are new to Industry 4.0 and the sensor data analytics space. (Please take a few minutes to read the prior blog post for a description of the basic business problems).

    It’s a data jungle

    As discussed in the last blog entry, most organizations have massive struggles with capturing and managing data from their assets. If you happen to work in such an environment, you will know this scene:

    System Architecture
    Spaghetti diagram galore: how does the sensor data get to people and applications?

    The OSIsoft PI System is all about simplifying this picture. It takes care of the full process for acquiring, archiving, managing and analyzing massive amounts of sensor data. Think of the PI System as a tool that takes care of getting data from the sensors to the users and applications that need it. This is basically a three step process:

    The OSIsoft PI System

    Data capture/ Collect

    It starts with collecting data. As outlined before, this can be quite difficult. The PI System therefore offers a library of 450+ interfaces for virtually any kind of industrial communication standard or specific assets. There is no custom coding and no sherlock-holmesing of ancient APIs. This not only saves a tremendous amount of time but also significantly lowers risk (bad data, etc.). Further, the interfaces are smart: there is essential stuff like data buffering, filtering of bad data, etc.. along with auto-discovery of data sources. This ensures clean and reliable data.

    PI Interfaces
    Got an old asset? No need to worry about custom coding. There are 450+ standard PI interfaces.

    Arrival in the OSIsoft PI System

    OSIsoft PI System

    Once the data has been collected, it needs to be stored & prepared for analysis. This is a big job that most databases are not made for. Keep in mind: Industrial sensor data is fast. 1-100hz data are not unusual and asset operators require timely information (i.e. NOW). The PI System stores the data immediately upon arrival and provides it to the users or applications in real-time. Yes, it’s a real-time system and that’s why you see PI in so many control centers around the globe. But just providing data in real-time would not be enough to satisfy the requirements of Industry 4.0. The PI System therefore does some really cool stuff such as calculations (simple KPIs and very complex mathematical formulas), unit of measure conversions, tagging of events, sending notifications etc…..

    In case you want to perform historical analysis, you can also query data from 10-20 years ago in mere seconds. All data is hot and available – no more complicated archiving and waiting. This is cool stuff – think about the massive data volumes that we are dealing with here. The OSIsoft PI System does all this without any complaints – it is optimized to provide industry strength performance and reliability.

    sensor data volumes
    Data volumes in the industry can be massive. Source: OSIsoft

    Context

    How do you want to make sense of this much data? Keep in mind that sensor stream naming conventions are weird and funky (e.g. TI37.109-CP-TK9PV). A white paper by OSIsoft sums up this problem:

    Typically, only a few initial users responsible for control system naming convention can fully benefit from the value built into the semantic namespace. Others spend valuable time trying to find and integrate the “right” operational data for analysis, roll ups. As a result, operational data often remain “dark” –untouched, underutilized or forgotten.

    What if we could attach those weird technical names to a metadata model (like a hierarchy)? That’s exactly what the PI System does: Tag names are attached to real-world assets such as transformers, pumps & reactors. You can then navigate the tremendous amount of data through a business view and you can also create asset templates for easy system configuration. Each template can not only contain standards such as calculations, units of measure & other useful stuff (read this case study for a nice example). In effect, working with the data has suddenly become a whole lot easier. Comparing one pump with another is possible just like standardizing the sensor data models across equal assets. This is very powerful stuff in a world that drowns in data but is starving for information.

    Sensor data context
    Notice the difference: The right hand side makes sense. The left hand side is simply confusing.

    Name those events

    Making sense of big data requires automated structuring of it. This is especially true for sensor data. In an industrial environment, we are always interested in analyzing specific events such as batch durations, start-ups, downtimes, etc.. These periods of time contain stories and insights that help you to improve processes. But they are notoriously difficult to find and compare when left unstructured. The OSIsoft PI System automatically bookmarking these events. You can then easily compare various batches or simply analyze what led to a downtime. This is really powerful stuff.

    OSIsoft PI Event Frames

    The last mile

    Now we have captured, archived and prepard that sensor data. But data is only useful if you really use it. That requires the timely and effective delivery to users and business applications. Rest assured that the OSIsoft PI System knows how to do that as well. It starts with real-time visualization clients, it includes a powerful SDK and also a really neat BIG Data integration tool. Discussing this in detail would be too much for this post, however.

    PI Coresight

    Big Data & Industry 4.0

    To summarize this longer than usual post: The OSIsoft PI System is your best friend when it comes to managing sensor data. Relational databases are not made for this type of data.

    Without an appropriate data infrastructure, Industry 4.0/ Digitalization efforts can quickly come to a grinding and frustrating halt. Does it require a lot get this up and running? No. Installations are usually fairly quick (we are taking days not weeks) and the hardware requirements are also nothing to worry about (it runs on my laptop).

    As always, thanks for reading and sharing!

  • Industry 4.0 and the sensor data analytics problem

    Industry 4.0 and the sensor data analytics problem

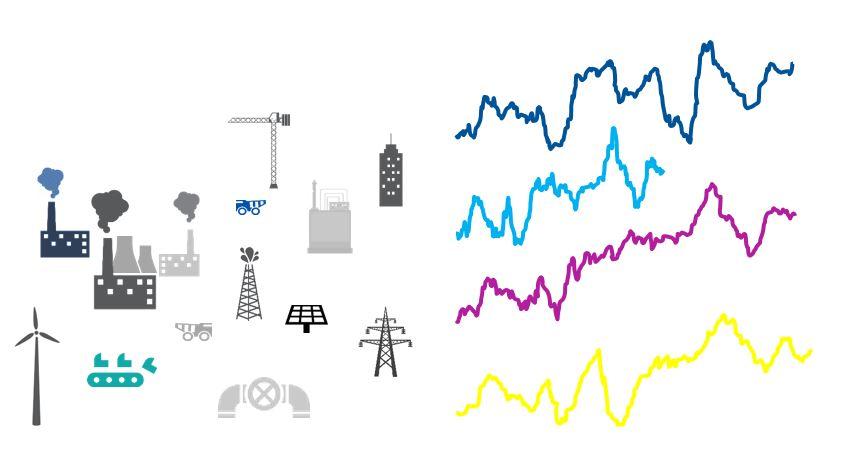
    That sensor data problem

    A few weeks ago, I met with a number of IT consultants who had been hired to provide data science knowledge for an Industry 4.0 project at a large German industrial company. The day I saw them they looked frazzled and frustrated. At the beginning of our meeting they spoke about the source of their frustration: ‘Grabbing a bunch of sensor data’ from a turbine had turned out to be a pretty daunting task. It had looked so simple on the surface. But it wasn’t.

    Industrial time series data

    Data hungry Industry 4.0

    In my last blog post, I looked at the Industry 4.0 movement. It’s an exciting and worthy cause but it requires a ton of data if executed well. Sensor data (aka industrial time-series data) from various assets and control systems is key. But acquiring this type of data, processing it in real-time, archiving and managing it for further analysis turns out to be extremely problematic if you use the wrong tools. So, what’s so difficult? Here are the common problems people encounter.

    1. The asset jungle

    When we look at a typical industrial environment such as a packaging line, a transmission network or a chemical plant, we will find a plethora of equipment from different manufacturers, assets of different ages (it’s not unusual for industrial equipment to operate for decades), control and automation systems from different vendors (E.g. Rockwell, Emerson, Siemens, etc.). To make things worse, there is also a multitude of different communication standards and protocols such as OPC DA, IEEE C37.118 & Modbus just to name a few. As a result, it’s not easy to communicate with industrial equipment. There is no single standard. Instead, you typically need to develop and operate a multitude of interfaces. Just ‘grabbing’ a bunch of sensor data suddenly turned difficult. There is no one-size fits all.
    Asset Jungle
     

    2. Speedy data

    Once you have started communicating with an asset, you will find that its data can be quite fast. It’s not unusual for an asset to send data in the milisecond or second range. Capturing and processing something this fast requires special technology. Also, we do want to capture data at this resolution as it could potentially provide critical insights. And how about analyzing and monitoring that data in real-time? This is often a requirement for Industry 4.0 scenarios.
    high speed data
    High speed data vs slow: what could you be missing?

    3. Big data volumes

    Not only is data super fast, it’s also big. Modern assets can easily send around 500 -10000 distinct signals or tags (e.g. bearing vibration, temperature, etc.). A modern wind turbine has 1000 plus important signals. A complex packaging machine  for the pharmaceutical industry captures 300-1000 signals.
    The sheer volume creates a number of problems:
    • Storage: Think about the volume of data that is being generated in a day, week or month: 10k signals per second can easily grow to a significant amount of data. Storing this in a relational database can be very tricky and slow. You are looking at massive amounts of TB.
    • Context: Sensors usually have a signal/ tag name that can be quite confusing. The local engineer might know the context, but what about the data scientist? How would she know that tag AC03.Air_Flow is related to turbine A in Italy and not pump B in Denmark?

    sensor structure
    Signal/ tag names can be extremely confusing

    4. Tricky time-series

    Last but not least, managing and analyzing industrial time series data is not that easy. Performing time-based calculations such as averages require specific functions that are not readily available in common tools such as Hadoop, SQL Server and Excel.  To make things worse, units of measure are also tricky when it comes to industrial data. This can especially be a huge problems when you work across different regions (think about degree C vs F). You really have to make sure that you are comparing apples to apples.

    5. Analytics ready data

    An often overlooked problem is that sensor data is not necessarily clean. Data is usually sent at uneven points in time. There might be a sensor failure or a value just doesn’t change very often. As a result you always end up with unevenly spaced data which is really hard to manage in a relational database (just google the problem). Data scientists usually require equidistant data for their analytics projects. Getting the data in the right shape can be immensely time-consuming (think about interpolations etc.).

    Uneven Time-Series data
    Unevenly spaced sensor data

    That tricky sensor data

    To summarize this: ‘grabbing a bunch of sensor data’ is anything but easy. Industry 4.0 initiatives require a solid data foundation as discussed in my last post. Without it you run the risk of wasting a ton of time & resources. Also, chances are that the results will be disappointing. Imagine a data scientist attempting to train a predictive maintenance model with just a small set of noisy and incomplete data.
    To do this properly, you need special tools such as the OSIsoft PI System. The PI System provides a unique real-time data infrastructure for all your Industry 4.0 projects. In my next post, I will describe how this works.
    What are your experiences with industrial time-series data?
  • Industry 4.0 & Big Data

    Industry 4.0 & Big Data

    Industry 4.0

    If you work in a manufacturing related industry, it’s difficult to escape the ideas and concepts of Industry 4.0. A brainchild of the German government, Industry 4.0 is a framework that is intended to revolutionize the manufacturing world. Similar to what the steam engine did for us earlier in the last century, smart usage of modern technology will allow manufacturers to significantly increase effectiveness.
     
    While there is a general framework that describes what Industry 4.0 should be, I have noticed that most companies have developed their own definitions. As a matter of fact, most of my clients lump the terms Industry 4.0, Digitalization and IoT together. Also, the desired objectives have a wide range and include items such as:
    • Improve product quality
    • Lower cost
    • Reduce cycle time
    • Improve margins
    • Increase revenue
    Industry 4.0 initiatives

    Industry 4.0 initiatives

    With a wide definition of Industry 4.0/ Digitalization comes an equally wide interpretation of what type of tactics and initiatives should be undertaken to achieve the desired outcomes. Based on my own experience, I see companies look at a variety of activities that include:

    When you think about it, each one of these programs requires a ton of data. How else would you go about it? Consider the easiest example: energy management. Reducing the amount of money spent on energy throughout a large plant by gut-feel or experience is almost impossible. It is the smart use of data that allows you to identify energy usage patterns, and hot spots of consumption. Data must therefore be the foundation of every Industry 4.0 undertaking.

    Big Data & Industry 4.0

    What type of data does Industry 4.0 require? It depends. Typical scenarios could include relational data about industrial equipment (such as maintenance intervals, critical component descriptions etc.), geospatial (e.g. Equipment location, routes, etc.) and most importantly sensor data (e.g. Temperatures, pressure, flow-rates, vibration etc.).
    geospatial information
    Sensor data enriched with geospatial information
    Sensors and automation systems are the heart of your Industry 4.0 program: they pump a vast amount of highly critical time series data through your various initiatives. Just like the vital signals from a human being allow a doctor to diagnose a disease, industrial time series data allows us to learn more about our operations and to diagnose problems with our assets & processes early on.
    Screen Shot 2016-07-12 at 21.38.49

    The value of industrial time series data

    Assets such as turbines, reactors, tablet presses, pumps or trains are complex things. Each one of them has thousands of valves, screws, pipes etc.. Instead of relying on intuition, hard-earned experience and luck, we can collect data about their status through sensors. It’s not unusual for specific assets to produce upwards of 1000-5000 signals. Combine a number of assets for a specific production process and you end up with some really BIG DATA. This data, however, allows engineers and data scientists to monitor operations in real-time, to detect specific patterns, to learn new insights and to ultimately increase the effectiveness of their operations.

    screen568x568

    What’s next?

    Industry 4.0/ Digitalization is an exciting opportunity for most companies. While many organizations have already done a bunch of stuff in the past, the hype around Industry 4.0 allows project teams to secure funds for value-add initiatives. It surely is an exciting time for that reason.
     
    But is dealing with industrial time series data easy? Collecting, archiving and managing this type of data can be a huge problem if not done properly. In the next blog post, I will speak about the common challenges and ideas for making this easier.