Blog

  • Watch that chart aspect ratio!

    The chart aspect ratio

    The other day I reviewed a dashboard. It looked great. But there was a chart on the bottom that just did not make any sense. It was way too long and stretched out. As a result, it was very difficult to use it appropriately. And that reminded me: We have to watch out for the chart aspect ratio.

    The basic idea

    Wikipedia defines the aspect ratio as follows: “The aspect ratio of an image describes the proportional relationship between its width and its height.” It’s as simple as that. We get confronted with the aspect ration when we purchase a TV or computer monitor or when we work with photographs. Does the aspect ratio matter? Oh, yeah it does! Take a look at the two photographs below. The first one uses the common HD 16:9 ratio. I cropped the second one down to a square format (1:1). Do you see the difference in the overall impression of the photo?

    Square Aspect Ratio
    16:9 (HD) Aspect Ratio: Can you feel the wide and open ocean?
    16:9 Aspect Ratio
    Square Aspect Ratio: Not that great. The boat has too much visual weight and the ocean does not seem vast and wide.

     Your charts

    The aspect ratio does matter for charts as well. We have to watch out for that when we create reports and dashboards or when we perform ad-hoc analysis. Not every chart aspect ratio works equally well. Take a look at the two examples below. Both of these charts have problems:

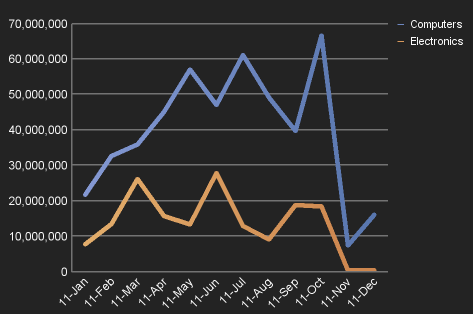
    It is difficult to make sense of the data. It is too flat.
    Chart Aspect Ratio
    The peaks are very pronounced.

    The first chart is definitely too flat – it is very difficult to analyze it. The second one is probably a bit too dense. The peaks are extremely pronounced and it would be easy to come to wrong conclusions.

    A better approach

    What is the idea aspect ratio then? Hard to say. It is typically a good idea to use a ratio that is wider than it is tall (2:1 or something like that). But it depends on what you want to show. From my point of view, it makes sense to experiment a little bit. I have noticed that some visualization experts have issues advice but I have found it to be very academic and hard to implement. To stick with the example from above, I did re-size the graph a bit and finally settled on this chart aspect ratio:

    Better Aspect Ratio
    This aspect ratio seems to work best for this data

    Your dashboards & reports

    Pay attention to the chart aspect ratio. Only because there is some space left in a dashboard does not mean we can or should stick a certain graph in there. The chart aspect ratio does matter quite a bit as we have just seen in these simple examples. Also, try experimenting with different chart aspect ratios when you perform analysis. Resizing charts with personal analytics tools such as Cognos Insight is really simple.

     

  • The Cognos Blueprints are back – for Cognos Insight

    IBM Cognos Blueprints

    Have you heard of the Cognos Blueprints? They are pre-configured planing and forecasting templates. You can download them from the IBM Cognos Innovation Center website. Each blueprint comes with a fully functional set of model definition files, model and business best practices documentation. There are over 50 different Cognos Blueprints available for functional and industry-specific processes. In the past, most models were available for either IBM Cognos TM1 or IBM Cognos Planning. Today, you can also download a few of the most popular Cognos Blueprints for the new Cognos Insight product. But let’s back up for a second.

    Cognos Blueprint
    A Cognos Blueprint

    Ideas and inspiration

    What’s the purpose of the Cognos Blueprints and how can you use them? Let me quickly tell you a story to highlight the value. A few years ago, my family and I moved to Europe. We rented a house that did not have a kitchen installed. Given that my wife and I love to cook, I thought it would be easy to walk over to the next kitchen store to pick something that we liked. Our enthusiasm quickly died. The available options were overwhelming. To make things worse, the first sales person immediately asked us for details that we were not prepared or qualified to answer (“Do you want the AW3-x series or the BT-4?”). It  quickly became obvious that we had no clue how to best go about ordering a kitchen – despite our love for cooking. (Stop here for a second – think about your business analytics implementations!). The initial “requirements gathering session” was a disaster and waste of time. But a sales guy in another store recognized our problem. He asked us to read a few brochures and wonder around the store to look at various different model kitchens before sitting down with us. And that’s what we did. Reading about configuration options and touching sample kitchens helped us understand. The meeting with the advisor went well. We were able to ask the right questions and provide important input. The brochures and model kitchens were our proverbial blueprints. They helped us gain knowledge and they helped us with visualizing the future state.

    Your projects

    Think about your business analytics implementations? When you first sit down with users, they have a hard time articulating their requirements. It is also very difficult for them to visualize how their planning process could look like in the new system. This is where the Cognos Blueprints help. They are a fantastic tool for learning about common business issues, best practices and modeling techniques. Use them to either educate yourself or to help your customers in the business. But be careful, blueprints are not necessarily intended to be implemented. Most organizations use them to get ideas and to learn more about a particular process. And they do a great job with that. I have used them in many projects.

    Analyticszone.com

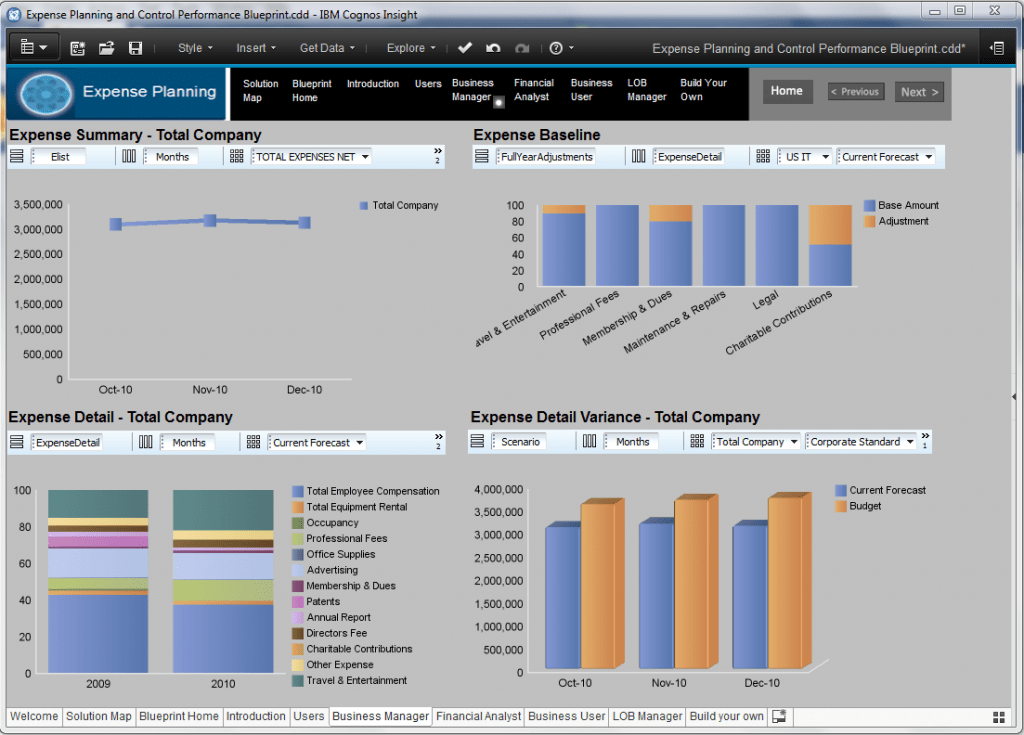
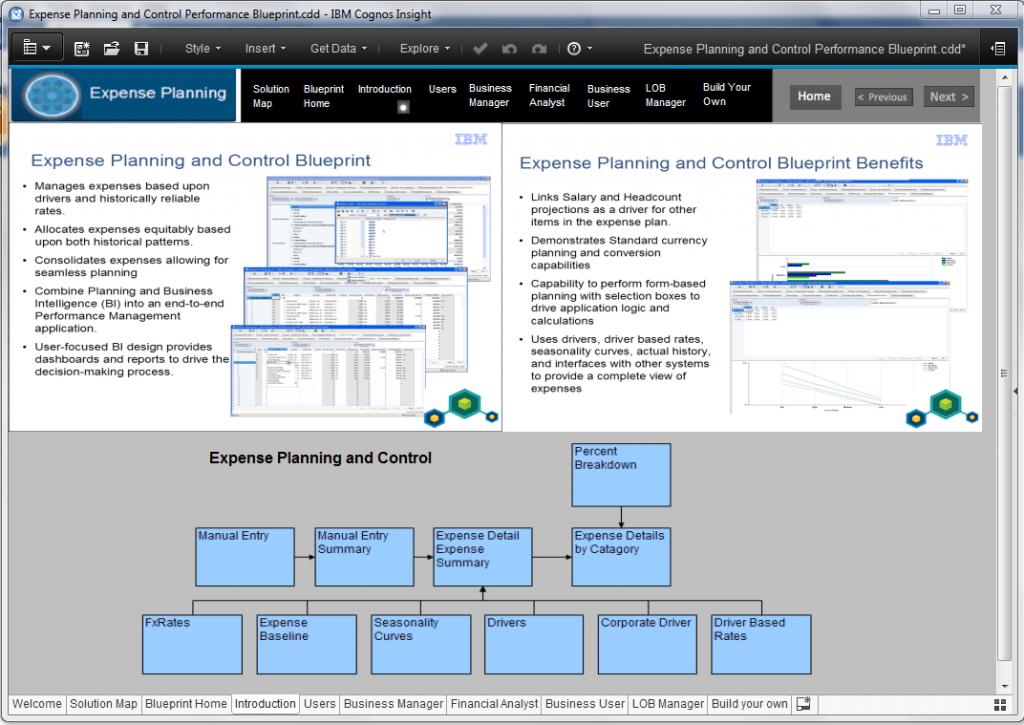
    A small library of Cognos Blueprints is now available for Cognos Insight. You can download them on analyticszone.com. You will get the cdd file and simply need to open it in Cognos Insight. I have not had time to play with them, yet. But they look very similar to the original ones. There is even a task bar that guides you through the process. So, take a look at the Cognos Blueprints today!

    Cognos Blueprint
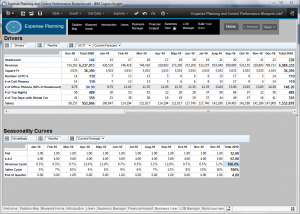
    A sample dashboard from the Expense Planning blueprint
  • How to improve your forecasting templates through initiatives

    Forecasting  concerns

    Despite its tremendous importance, forecasting remains one of most disliked processes in many companies. Part of the problem are the forecasting templates themselves. They are extremely complex and cumbersome. Today, I want to look at a simple technique that can improve the usability of the forecasting templates while also increasing the ability to gain insights from them. A few months ago, I provided another technique that involved the time-horizon. Let’s take a look!

    Forecasting templates

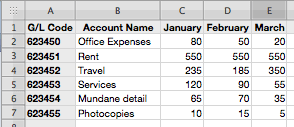
    Typical forecasting templates follow a certain pattern: Across the columns we can find the different months of the fiscal year. The rows feature hundreds of G/L accounts:

    Budgeting Template
    Graphic 1: The traditional forecasting & budgeting template

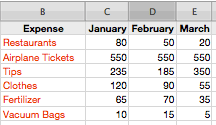
    Let’s be honest: this type of template is really difficult to use. First of all, there is an excruciating amount of detail. The structure also does nor provide a solid picture of our business. Think about it: Business managers do not think in terms of G/L accounts. You don’t believe me? Thought-leader David Axson once proposed to try this approach at home to see how difficult it really is. This is what our personal forecasting template would look like (oh…please….don’t try this at home….):

    Forecasting Template
    Graphic 2: The family forecast?

    We can argue about this, but I doubt that our families would appreciate it. My wife Jen would certainly send me off to see a shrink…

    Initiatives

    Let’s stick to the example of the personal forecast. If you think about it, most of us intuitively follow a different approach. We use projects and initiatives to structure our thoughts. Many people typically start budgeting or forecasting by creating a list of initiatives they are planning to do. Then they figure out the associated amounts:

    Family Budget
    Graphic 3: Initiative planning at home. A better approach.

    This forecasting template provides us with a mental framework that is easy to follow. The naked account list on the other hand does not provide us with any help. We simply think about amounts without being forced to ask ourselves more intricate questions like why, what, where, etc.. And this is what often makes the process so difficult, especially for non-financial people.

    Revisions

    The beautiful thing about using initiatives in forecasting templates is that it makes revisions a lot easier. Let’s say we want to cut our expenses by 5%. Using the traditional line item approach, this will become a difficult if not random exercise (how would you know in the first place?).

    Budgeting Template

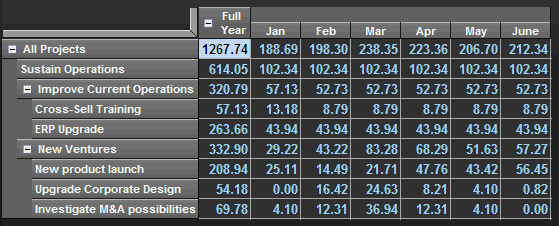
    Where do you start? Most of us would probably be tempted to reduce a few numbers here and there. The data is just too complex. Contrast that to the approach in the next screen shot. This is a lot easier to deal with. The initiatives provide context. All expenses that are not related to a project have been captured in the ‘Sustain Operations’ bucket.

    BudgetingTemplate

    You can immediately sit down and review the different initiatives. Questions like: “Which initiatives are really critical?” come to mind. Ranking them provides additional context.

    Next you could drill down on each initiative and review the different expense types. Notice that the use of initiatives speeds up the process while also providing better insights.

    Your forecasting templates

    Take a look at your corporate budget. Where can you incorporate initiatives and projects in your forecasting templates? Granted this approach does not work in all situations but it is a relatively simple thing to do. But most cost centers can probably benefit from this approach.

    P.S.: The screenshots were created with Cognos Insight.

  • Why you should add prototyping to your toolbox

    The value of prototyping

    Last week, I came across an excellent post by the Truly Deeply blog. It was titled ‘Brands need to Innovate or they will fade‘. The author of the blog argues that brands are under pressure to innovate their products and services. But innovating becomes harder and harder as the “future is less and less an extrapolation of the past“. While this is nothing new and surprising, the post provides an idea of how companies can stay innovative. The writer describes a technique that business analytics professionals need to be familiar with: prototyping.

    Prototyping boosts thinking

    Dubai Marina
    Prototyping helps you explore ideas

    The author(s) of the Truly Deeply blog describe how the famous design firm IDEO leverages prototyping to rapidly innovate. Rather than sitting down with a blank sheet of paper and waiting for inspiration, IDEO typically get immersed in a new topic that they are working on. Not only that: they jump right in the water and start prototyping new ideas very early during any given project.

    “They refer to it as ‘building to think’ instead of thinking about what to build.”, The Truly Deeply Blog

    But why does prototyping work for them? It kick-starts the learning process (see quote above). Prototyping allows them to play with their ideas and to expand their thinking. Let’s keep in mind: theories on a piece of paper rarely inspire. And once you have a prototype, you can start making sound decisions that are based on direct and hard evidence. This in turn can help you with obtaining commitment. This is especially important when people are risk-averse or lack understanding.

    “The power of prototyping or pilot testing is you fast track moving to evidence based decision making.”, The Truly Deeply Blog

    Prototyping and Business Analytics

    I couldn’t agree more with the Truly Deeply blog. Prototyping is an extremely valuable technique. Every business analytics professional should add it to the toolbox. Traditional IT project management taught us that we had to write lengthy requirements and design documents. But the problem with that approach is that business and IT have a very hard time figuring out and agreeing on what is really required. I wrote about those problems a while ago. Prototyping on the other hand allows the analytics professional to rapidly understand the true requirements. At the same time, the business person can quickly identify how the new solution can add value.

    Prototyping in Action

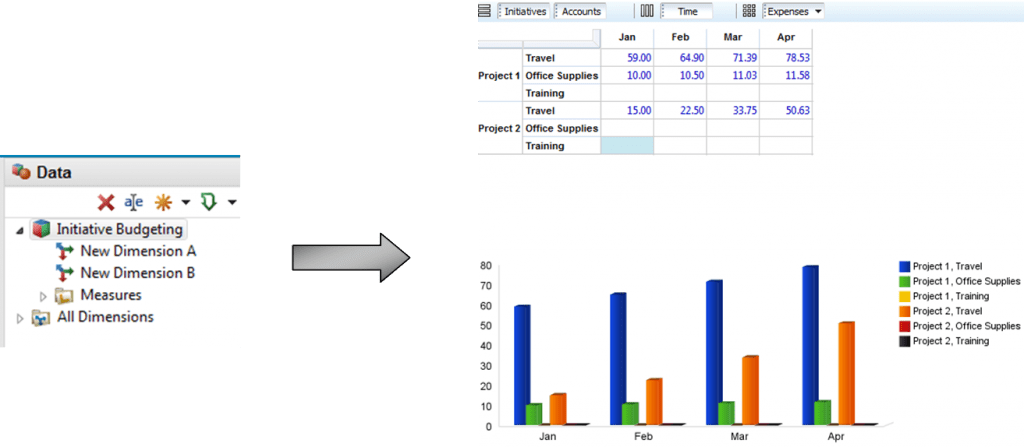
    Prototyping doesn’t have to be difficult and time-consuming. The new Cognos Insight solution, for example, allows business users to do prototyping by themselves. With Cognos Insight you can not only explore data but also develop small models on the fly. Take a look at the picture below. I started with an empty workspace and developed a prototype for an initiative-based view of my budget. This took a few clicks and some minimal typing. All that in under 2 minutes. And now I can go ahead and play with prototype and test drive it. Contrast that to a dry requirements or design document.

    Prototyping with Cognos Insight
    Prototyping under 2 minutes

    Prototyping creates value

    Make sure to add prototyping to your toolbox. It is tremendously helpful and valuable. I argue that proper prototyping significantly increases your success rate. Cognos Insight especially allows you do develop neat prototypes for dashboards, reports, plans, budgets and forecasts. But keep in mind: prototyping should never violate good solid project management processes. You can read more about that in a prior post.

    How can you leverage prototyping to advance your thinking or that of your users? What are your experiences with prototyping?


  • Business Analytics news for the week

    Business Analytics news

    This has been an extremely busy but exciting week. It seems like the whole world is full of energy. Here are a few things you might want to be aware of.

    CFO.com Webinar Forecasting

    If you are interested in forecasting, make sure to register for the upcoming CFO.com webinar ‘Forecasting in turbulent times‘. Together with Tom Willman (Principle, The Hackett Group), I will discuss trends and best practices for improving your forecasting processes. The webinar is scheduled for Thursday, March 15th.

    cfo.com

    Cognos Insight & TM1 10.1 launch

    Yesterday was the official launch event for Cognos Insight and TM1 10.1. I was blown away by how many people participated. As a track host, I was especially excited to see so many questions coming through. In case you missed it, you can still watch most of the sessions on demand. I highly recommend the keynote. Robby Meyers from DirecTV gave a fantastic demo of Cognos Insight. Make sure to watch that one. It’s great to see how a successful company like DirecTV leverages Cognos Insight.

    Analyticszone.com

    There is a great new website and community entirely dedicated to Cognos Insight. Make sure to check it out. The new site provides you with a bunch of great stuff: sample Insight models, tutorials, discussion forums etc.. You can also download a revised version of the famous IBM Cognos Blueprints. Yes, they have been redesigned to work in Cognos Insight. Make sure to also upload your files and share your experiences!

    Analyticszone.com

    Updated iPad app

    There is an updated version of the Cognos iPad app. You can downloaded it directly from the iTunes store. The latest version has a slightly different look and feel. It also feels snappier. There are also a bunch of other enhancements under the hood. And there is also additional demo content in there. The upgrade takes about a minute. And….can you imagine how awesome all your Cognos report will look on the new resolutionary iPad?

    Harriet & Christoph – the story continues

    Want to see me as a bobble head? Some of you may have watched the Cognos Insight demo at the IBM BA Forum in October 2011. My colleague Harriet Fryman and I demonstrated how the business and IT can get along using Cognos Insight. Our creative team took that story and has created a series of hilarious bobble head movies. The latest edition was released last night. In the prior video, Harriet put Sleep-eeze into my coffee. Time to get even! The other parts are also available on You Tube.

  • Please welcome IBM Cognos TM1 10.1

    IBM Cognos TM1 10.1

    There is a lot of exciting stuff happening in the Business Analytics area. Last week, I wrote about the release of the personal analytics tool Cognos Insight. But there is more. Along with Cognos Insight, IBM also released the latest version of TM1. And let me tell you, IBM Cognos TM1 10.1 is a significant release. There is a lot of new and really exciting stuff in there. Here is a really short preview. If you want to see more, make sure to register for the official virtual launch on Wednesday, March 7th.

    Performance Modeler

    One of the most significant enhancements to TM1 10.1 is the addition of Performance Modeler. This is the environment where you can build and maintain the different models for planning, forecasting, profitability analysis and such. Performance Modeler provides new and highly visual tools for getting the work done. There are guided processes for standard tasks such as importing data and deploying models to end users.

    Performance Modeler
    TM 10.1 – New modeling workbench

    (more…)

  • Cognos Insight is here! A first look.

    Cognos Insight & Personal Analytics

    Exciting news! The latest member of the IBM Cognos family of business analytics solutions IBM Cognos Insight is here. This solution will provide business users with analytical freedom while allowing IT to maintain proper control.  Some of you have might have already seen a demo.  The purpose of this post is to give you a really quick overview of Cognos Insight. Please keep in mind, though, that this post won’t cover all the exciting things you can do with this new solution. Check back for follow-up posts later this month.

    Cognos Insight sits on the desktop

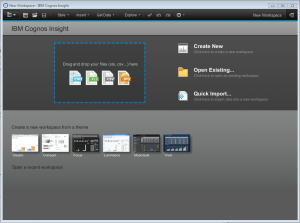
    Cognos Insight Home ScreenCognos Insight is a desktop tool that allows you to do a lot of things: data exploration, analysis, what-if scenarios, planning, forecasting, dashboarding, prototyping, etc.. You download it and install it on your Windows machine. Having the software on your desktop provides you with the advantage of being able to work in a disconnected and connected mode while leveraging the full power of your machine. Speaking of power and speed – Cognos Insight runs in-memory. The product is based on the highly successful IBM Cognos TM1 engine. When you first open it up, you will see the desktop that invites you to create a new workspace or to open up existing applications.

    (more…)

  • Freedom to think?

    Change that viewpoint

    Last summer I participated in a Bavarian wedding.

    As a photographer I was really excited to see three traditional alphorn players. The early results looked good on the camera monitor (left photo). At that point I was tempted to pack up and celebrate with my friends. But I resisted and began to experiment with different viewpoints. The final shot ended up as my personal favorite (photograph on the right). Same scene, different perspective. Changing viewpoints paid off.

    Alphorn

    Business Analytics and Viewpoints

    Changing our viewpoint is especially critical for Business Analytics. (more…)

  • The power of what if analysis

    What if analysis

    What do Steve Jobs, Albert Einstein, Thomas Watson and Pep Guardiola (coach of FC Barcelona) have in common? – All of them have challenged the old and set ways of doing things. Challenging old ways provided them with new opportunities and their success speaks for itself. That raises a question: What can we do to challenge set views to be more successful? Indeed, there is a very simple tool that most of us ignore: what if analysis.

    What If?

    Asking what if can help us see our world in a new and fresh way. Why? Humans are creatures of habit. We are often stuck in our old and set ways and often see just the familiar patterns around us. This limits our thinking and we often miss opportunities or risks. It restricts our creativity. Take a look at Kodak. If we can trust reports in the newspapers, former management assumed that film and paper photography would prevail. That’s what most employees were comfortable with. What if digital photography became the standard?

    What if analysis can therefore help us identify risks and opportunities. What if analysis can help us make better decisions about the future.

    “Creativity is the ability to see things in a new way, a way that combines existing things, viewpoints, elements, in a way that hasn’t been done, or  in a way that uniquely solves a problem. It is, in short, the power of “What if…?”  David du Chemin, Photographer

    Examples of what if analysis

    What if analysis can be extremely powerful in business. Think about these questions:

    • What if air traffic was shut down due to another volcano? What would this do to our supply chain?
    • What if we offered our client a new discount model? Would they buy more products in the future?
    • What if we were able to reduce our expenses by 5%? How much flexibility would we gain?
    • What if every employee reduced their business travel by just one trip per year?
    • What if we changed our fixed phone plans to variable ones? Would we be able to save cost?

    Developing those what if questions is the first step. The second step requires us to understand the answers and the potential impact on our business.

    Obstacles to what if analysis

    what if analysis
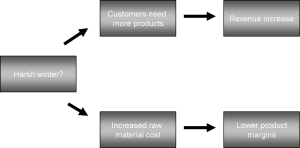
    What if the winter was really harsh? Increase production capacity?

    It is the second step where we need to sit down and play with our planning and forecasting models. We sometimes even have to create small models from scratch to identify the right answers and solutions. But that part is often too complicated. Corporate data is complex. Spreadsheets are often too cumbersome and slow to handle the complexity. As a result, too many people shy away from performing what if analysis.

    Start: What if analysis

    Start asking what if questions today. It is a very powerful too, indeed. And it is not only limited to business.


  • A post full of business analytics updates

    Here are a few updates, news and noteworthy links for this week.

    New book about Performance Management

    Make sure to check out the latest book about Performance Management written by Steve Player and the late Jeremy Hope. It’s called Beyond Performance Management: Why, When, and How to Use 40 Tools and Best Practices for Superior Business Performance. I just downloaded it for my Kindle and will post a review as soon as possible.

    IBM Finance Forum 2012

    IBM Finance Forum is a great event for all finance professionals. (more…)