The Tour de France
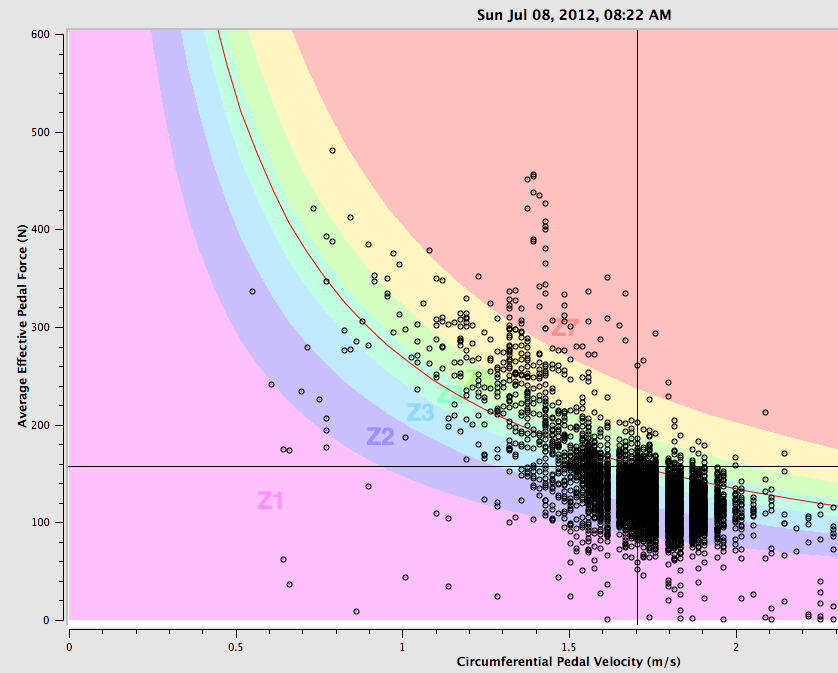
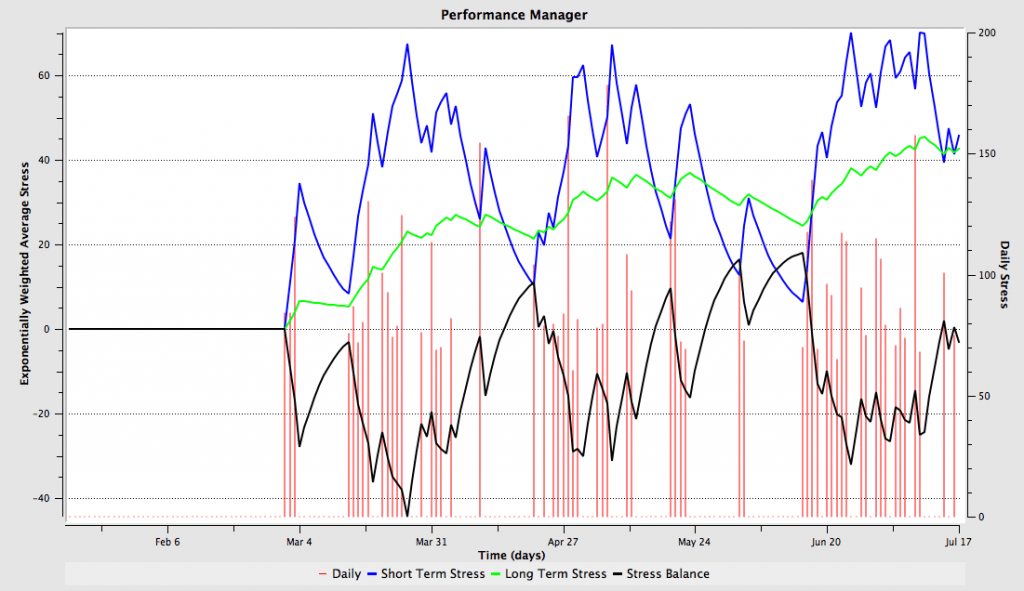
The toughest sporting event of the year is in full swing right now. No, I am not talking about the Olympics. I am talking about the Tour de France. No other sport requires its athletes to perform at the highest level for 21 consecutive days. Think about this: Riders burn an average of 4000 calories per day. To win this unique competition you need to do everything right and you need to have a bit of luck as well. It is therefore not surprising that top athletes leverage smart technology to help them. As a matter of fact, most top cyclists leverage so-called power-meters to collect and analyze ride data. Think of it as business analytics on a bike. And guess what – the athletes & their coaches do it really well. Here are a few simple lessons that we can learn from the pros:
- Pick a balanced set of metrics: Improving your performance requires you to look at various measures. Cyclists, for example, look at things like cadence, power output, heart rate etc.. Each one of these metrics influences performance. It’s the combination of them that allows riders to make sound decisions about their training programs and racing strategies. Do you have the right mix of metrics that allows you and your team to perform well? Managing sales is much more effective by looking at metrics such as # of new customers, avg $ per sales order etc.. Just looking at revenue alone creates a limited view.
- Monitor the relevant metrics:It’s nice to have a lot of metrics to work with. But make sure to pick the ones that are actually relevant to your business. Cyclists for example are ultimately looking to increase their speed. However, speed is very hard to control. It’s heavily dependent on outside variables such as wind, terrain, tire friction etc.. Monitoring speed on a continuous basis is therefore no recipe for improvement. As a matter of fact, it would be a counter-productive exercise (think about a day with lot’s of tail-wind). Cyclists therefore focus on the above mentioned metrics. They have direct control over these and improving them will lead to higher average speed. What about your metrics? Are you monitoring the relevant ones? Managing the marketing department with revenue metrics alone is not that effective, for example. You’d rather leverage metrics such as # of leads generated, brand equity etc.. Those metrics are in direct control and they influence the overall goal of increasing revenue.
- Consider relative measures: Power output (watt) is a key metric in cycling. The higher the power output one can produce, the better. But watts by themselves do not allow you to compare progress over time. Let’s say I am able to produce 300w over one hour today. Last year, I was able to produce only 280w. Have I improved? Will I be able to ride up that hill faster? It depends. We would have to look at my weight. The heavier I am, the more power I need to maintain a certain speed. And that’s why cyclists closely watch relative metrics. Watts/kg is one of the key metrics. It allows them to compare themselves with other riders and they can carefully track their progress. Are you looking at some relative metrics? Think about marketing, for example. We could be tempted to simply look at the number of leads that a certain campaign has generated. Sure, that is an important metric. But we should also look at the cost per lead. That allows us to compare different campaigns.
- Leverage data:It’s nice to have a ton of data available. But it’s only useful if we turn that data into information through analysis. Leading coaches and riders spend a lot of time analyzing ride data. They look for insights and they use these insights to refine their program. Businesses have a wealth of data available. Unfortunately, not all of it is used appropriately. I recently met a company that has terabytes of clean customer data sitting in their databases. None of it is being used right now. Such a shame. It happens way too often.
- Merge information with intuition: Data is great and data (hardly ever) lies. Yet, it is critical to listen to your inner voice as well. The best cyclists in the world leverage all their analytical insights and merge them with their intimate knowledge of their own body. They intuitively know when they can attack. It’s the same in business. That NPV model might look great on paper, but our gut tells us that the investment is wrong. Let’s not forget that!
- Change that plan: Athletes spend a ton of time planning their training schedules. They use scientific methods to predict their peak performance. But no plan is fool-prove. Things are likely to change. Top pros therefore adjust their schedule on a rolling basis. There are days when they simply can’t pull off a hard interval session. Sure, they could try to do it. But that could have a devastating effect on their engine (body). Likewise, there are also days when their body feels surprisingly fresh. In those cases they increase their training load. Too many businesses create plans and stick with them regardless of what is happening around them. That is not only risky but it also often prevents companies from outperforming (think about all those expense budgets that are rigorously spent each year…).
The Tour de France by numbers
Take a look at these lessons and see how you could apply these to your business. Granted, cycling is a simple sport. But they face a ton of pressure. The best riders are separated by a mere 1-2% in overall performance. 2011 research by the CFO Executive board has shown that CFOs believe their finance departments perform 30% below their performance potential. What does that tell you?
P.S.: If you like sports and analytics, make sure to follow the daily coverage of Trainingpeaks.com. They feature detailed ride analysis and such. There is some fascinating stuff.


