Road biking is a big passion of mine. The other day I was out on a long training ride with a good friend. One of the nice things about biking is that you can talk a lot on those rides. Since we were talking about different aspects of our work, my friend finally wanted to know what was so special about this “Business Analytics stuff”. How do you best explain that to somebody who is only remotely connected to IT, Finance and management? Luckily, I had a great story to tell him. And it’s not just a regular story. It is actually my personal success story in cycling.
HIGH TECH
About a decade ago, modern technology entered the world of professional cycling. Smart technology became available to measure not only the typical parameters of cycling like speed, distance etc.. This new piece of technology was called a “Powermeter”. This high-tech gadget allowed cyclists to measure advanced data such as power output, pedal torque, cadence etc.. Today some of these devices even measure aerodynamic drag. Powermeters help athletes like myself to learn about themselves and to perform better. Needless to say, I invested in this technology about five years ago. It is a CycleOps Powertap with Bluetooth technology.
THE ERP OF CYCLING
Ok. But what does that have to do with Business Analytics. Very easy. The Powermeter is my transactional system. It records my ‘business’ on the bike. Second by second. Mile by mile. While I am riding, I can check my speed, power output, cadence and many other things. Just like a good solid ERP system. The gadget allows me to manage the operational aspects of my ‘cycling business’, i.e. I can lower my power output, increase cadence etc..
ENTER ANALYTICS
After each ride, I can then download the ride data. There is an extremely awesome piece of software called WKO+. It was created by two smart cycling professionals that have conducted ground-breaking research. This application helps athletes analyze their ride data. The objective is to become smarter (think knowledge about your own body) and to make better decisions about your training. This is basically Business Analytics for cyclists. Let’s take a look at how this works.
THE DASHBOARD
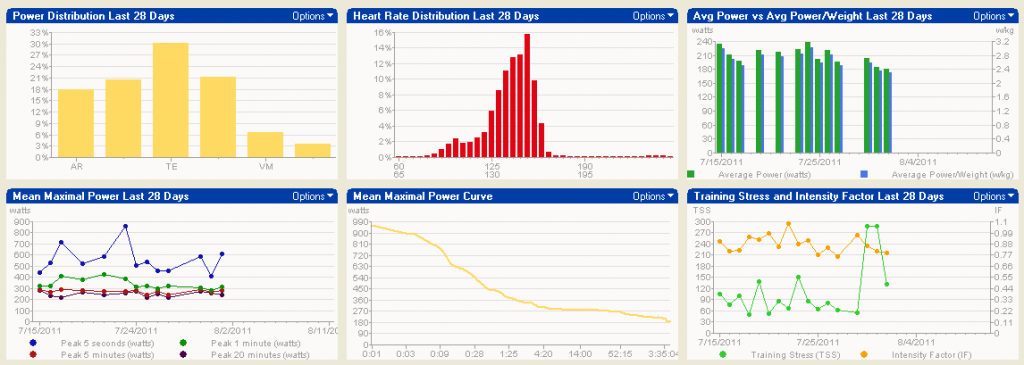
After each ride, I can analyze a Dashboard. This dashboard provides me with an overview of my most important metrics such as power output, mileage, cadence, time in training zones, etc.. There is a daily and a monthly dashboard. This helps me identify potential issues and to check my overall performance and progress. In Business Analytics, we implement dashboards for our executives and managers. The only difference is that they look at different metrics like sales, margins, profits.

ANALYSIS
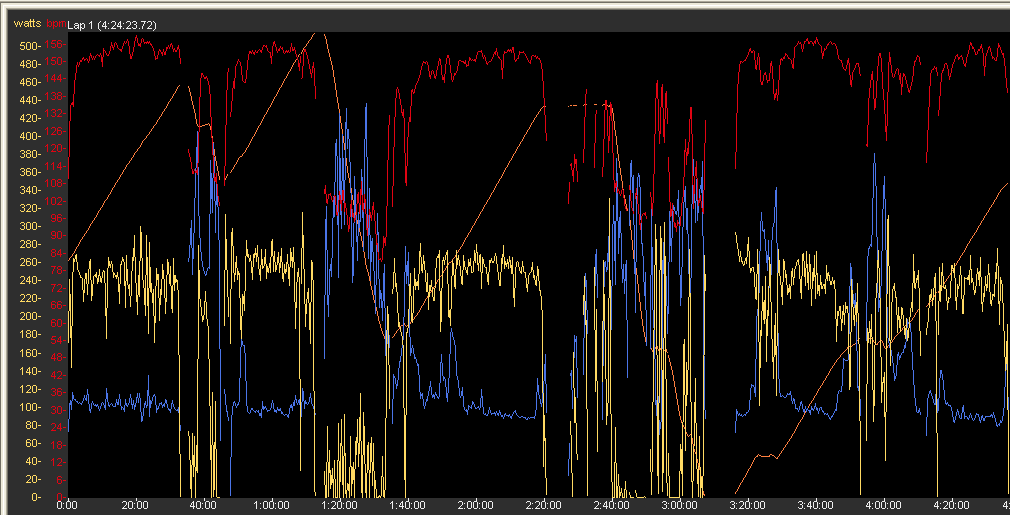
If I spot something curious, e.g. an unexpected poor performance on a ride, I can immediately drill down to analyze the detailed data from my ride. This analysis contains a detailed report of some metrics and I can visually analyze the ride second by second. Going through the data, I can spot interesting things like power spikes, rest periods etc.. This helps me put the overall picture together of why I performed in a certain way. The analysis also helps me learn more about myself: what are my boundaries, what are my strengths etc.. The same thing is true for Business Analytics. If we spot some problems or opportunities, we perform analysis using our rich transactional data. This helps us identify critical business insight.

LOOKING AHEAD
Now that I have understood how and why I performed on my bike I can start using this information to plan and adjust my upcoming training plan. There are some smart algorithms in the software that help predict future performance based on past power-output and training load. Using this inside, I can then fine-tune my training plan and hopefully scare my riding friends by outperforming. Many companies leverage Predictive Analytics to make sense of data and to look ahead. They want to identify customers that might be more profitable in the future. They might want to spot opportunities for cost savings. And they use the insights to formulate and update their business plans.

THE ROI
My friend now understands clearly what Business Analytics is all about. Since I was able to seriously drop him on a climb he was curious about the ROI of this. Well, the technology has enabled me to learn a ton about myself. I know my boundaries and I am able to push myself much further than I ever have. I was able to survive a grueling 7 day stage race across the Alps and all that with a minimum of preparation. All that by being smart about my racing tactics and most importantly about my training approaches. The same thing is true for businesses. I have worked with companies that have literally transformed the way they do business using the insights offered by modern Business Analytics software. This software now represents the central nervous system of these organizations. Why don’t you try that yourself?
If you are interested in learning more about how I use a powermeter during training, please read my personal blog:

Comments
7 responses to “Business Analytics and the art of cycling”
Nice analogy, Christoph! You did more than survive the TransAlp – you did an excellent ride. That was a nice ROI!
With 30years in IT, 25years as a triathlete, and a 4year powermeter owner(Ergomo / Quarq) … This is a great article !!
Thanks, David!
Great feedback, Christoph. This is an excellent explanation of Business Analytics in the personal anecdote which I think you should utilize in your workshops as a ‘starter’ explanation for everyone to grasp Business Analytics. Also, I just learned about some great software for my own cycling program!!! Many thanks.
Great post with an easy to grasp and memorable analogy, Chris! Looking forward to your next post! 🙂 Sylvia
Good stuff, Christoph – I hope to finally go biking with you next season!
good story & analogy for a presentation
Jaromir