Blog

  • The new IBM Cognos Mobile iPad app is nice!

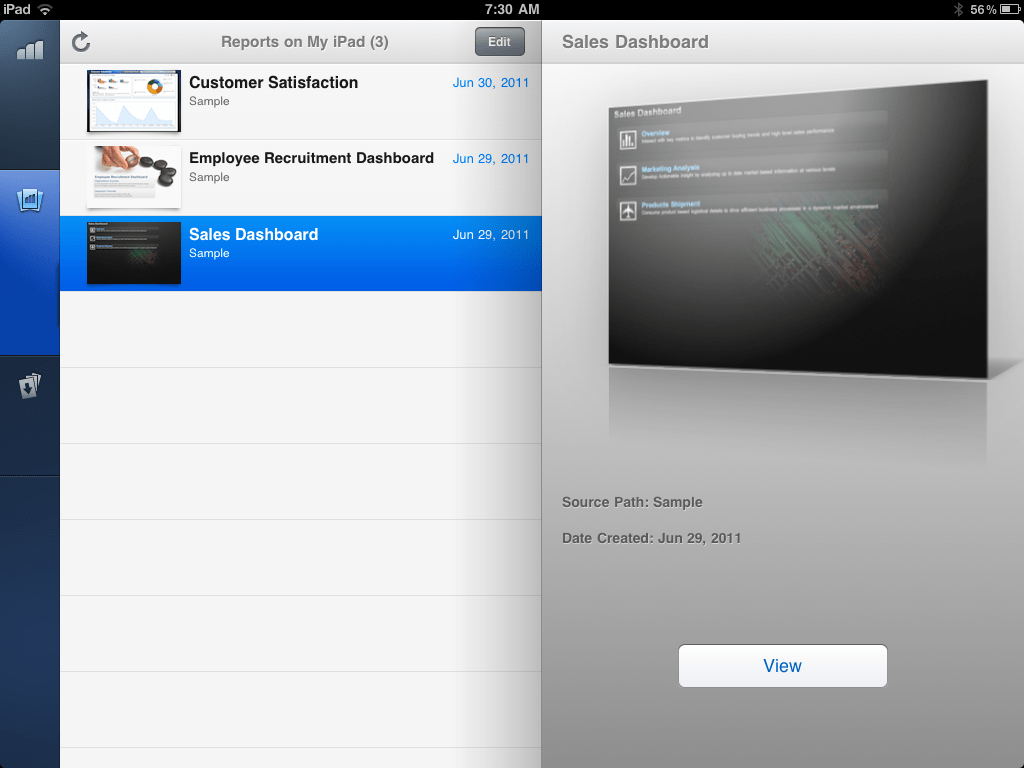
    Just a quick post for today. It’s been a super busy week with stops in Barcelona, Munich and London. While sitting in the lounge in Munich, I was delighted to see that the IBM Cognos Mobile iPad app had been approved for the Apple iTunes store. A perfect opportunity to download it and test the offline capabilities at 33000ft cruising altitude. (I cannot wait to take the the app online this weekend!)

    CLEAN AND SIMPLE

    Once our plane had taken off, I pulled out my iPad and launched the app. European flights do not have WIFI, yet. But the app does support offline content. And so I was sitting there in seat 5D somewhere above Frankfurt and was able to test some of the dashboards and reports. Being able to work offline is a huge advantage, from my point of view. I have personally encountered so many situations where the wireless network was either poor or simply not accessible. But back to the Cognos app: The initial impression is excellent. The interface is nice and clean. It does not take any time at all to get up and running. Navigation is intuitive and all the usual finger movements (swiping, pointing etc.) work flawlessly.

    IBM Cognos iPad
    Offline content

    (more…)

  • Mark Jeffries: “Have you invested in yourself?”

    GUESTPOST BY MARK JEFFRIES

    In the IT business – we have a big advantage. Very cool solutions that truly help businesses solve problems. Nice!

    However, that is not our challenge. The IT challenge is actually whether your target – be it client, colleague or boss – actually wants to buy YOU!  The unspoken questions become – ‘what value do you bring’, why should I trust you? What will YOU do for me?

    Businesses understand that with an economy in a fragile recovery, it is impossible to ruthlessly raise prices and to aggressively grab market share. Instead, it would appear that the game is to add value, offer the customer more and constantly justify their  existence.

    From an individual perspective, we need to take note. Taking a leaf out of the book of ‘big business’, for our own use as individuals, is worth a go.

    WHAT ARE YOU WORTH??

    Never forget that people buy people – and every time that you explain the benefit of your offering, the value of your products or the brilliance of your service –  people are really choosing whether they buy YOU or not. Here are some ideas on how you can increase your own buyability.

    (more…)

  • The Performance Manager

    Have you heard of the Performance Manager book? If not, you should take a look at it! The Performance Manager is a book that can provide a lot of value to you and your Business Analytics projects. Some people describe it as a ‘Recipe book for Analytics’. Mike Duncan recently blogged about designing dashboards and selecting the right KPIs. The Performance Manager publication is a great tool to help you with that.

    THE RECIPE

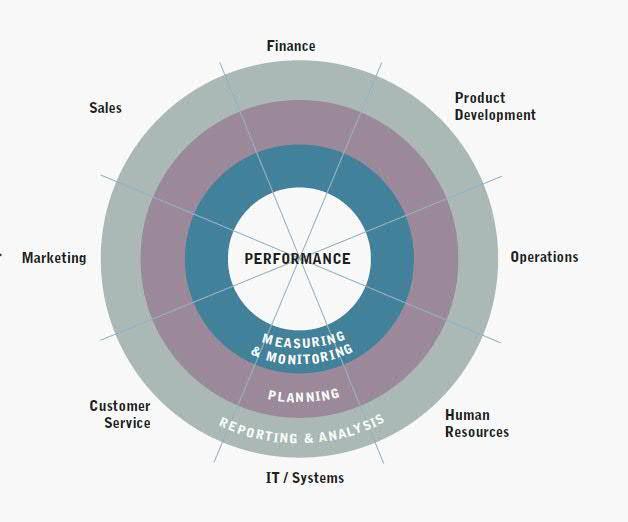
    First of all, the Performance Manager is not necessarily a book that you read from the first page to the last. No, it is rather a smart compendium that you pull out when you need it. The basic idea of the book is to provide the readers with deep insights and ideas about the type of goals, metrics and responsibilities they need to think about when designing new reports, dashboards and planning templates. The book is structured around the eight primary functions of a typical business (Finance, Marketing, Sales, etc..). The Performance Manager

    (more…)

  • How to present numbers more effectively

    PRESENT NUMBERS MORE EFFECTIVELY

    My family and I just returned from a fantastic vacation on a cruise ship. On our last day we attended a Q&A session with the captain and a few of his officers. People were very interested in the details of the ship. The captain quoted a few numbers:

    • Weight: 85,000 tons
    • Installed Power: 48,000 HP
    • Length: 264 meters
    • Beam: 32 meters
    Mein Schiff
    Our 85,000 ton cruise ship

    While the figures are certainly impressive I realized that they do no mean much. My boys asked the obvious question: “How much is that?” The numbers are just too difficult to understand. Indeed: What does 85,000 tons really mean? (Have you ever lifted something that heavy?) Plain digits rarely resonate with people – they do not communicate a story and they are often hard to understand. And this can be problematic in business when we present figures. We typically present them to tell a story and to instill action but the sheer nakedness of the digits hides the true meaning.  That’s what happened during the presentation of the cruise captain.

    CONTEXT AND MEANING

    A better approach is to present the numbers and put them into context with something we are all familiar with. It helps people understand. This is especially helpful for larger numbers like the examples above. Let’s take a look:

    • 85,000 tons is about as heavy as the combined weight of 56,667 BMW 5 series sedans.
    • 48,000 horsepowers is the equivalent of 240 BMW 525d limousines pulling in unison
    • 264 meters is as long as 2.6 regular soccer fields
    • 32 meters is about half as wide as a soccer field

    Here we go: 2.6 soccer fields long, with a huge stack of cars on top and a few hundred Beamers pulling the thing. Now that puts this into perspective and it is actually quite impressive. My kids understand that and they had a serious look of surprise on their faces.

    STEVE JOBS – THE MASTER

    One person who has perfected the technique of explaining and making numbers shine is Steve Jobs. He has delivered some classic explanations in recent history:

    •  “1000 songs in your pocket.” ….Jobs is explaining what a 5GB iPod is able to do
    • “Our market share is greater than BMW or Mercedes in the car industry.” ….Jobs was critized about the low market share number of 5% in the computer industry back in 2003

    ENHANCE YOUR NUMBERS

    When you present numbers, try to put context around them. Compare them and relate them to something relevant. Pick something that your audience is familiar with. This technique is extremely effective and can really amplify your message. And it is not all that difficult. Best of all: you can use it in many different situations. Whether it is in a business meeting, your next presentation or to simply explain a few things to your kids.

    “Remember, data is a representation of real life. It’s not just a bucket of numbers. There are stories in that bucket. There is meaning, truth and beauty.” Nathan Yau

    P.S.: Speaking about context. Here is a fine example. We happened to spot the marvelous “A” yacht of Russian billionaire Andrei Melnitschenko. Look at the first photo and then scroll down to look at the second one. The first photo makes it difficult to assess it’s true size. It is hard to believe that this ship is a bit longer than a soccer field. The second photo provides the context of the fishing boat.

    The "A" Yacht
    How large is this gorgeous yacht? Hard to tell from the picture.
    A Yacht
    The small boat adds the context


  • The TripIt app is the perfect business tool

    There are a bunch of apps for the iPhone and the iPad that I would not want to miss. But there is one that certainly sticks out because it really helps me. I am talking about TripIt. TripIt is a very cool service for all business travelers. Before I found this service I always struggled with filing and arranging all my different travel details. Adding the stuff to my calendar was even worse. My wife Jen hardly ever knew where I was staying. And I can honestly admit that I have driven a bunch of cab drivers crazy when I tried to retrieve hotel addresses on my Blackberry. But one day I heard about TripIt. And wow….I was blown away. It’s not fancy but it does a few very simple but highly effective things:

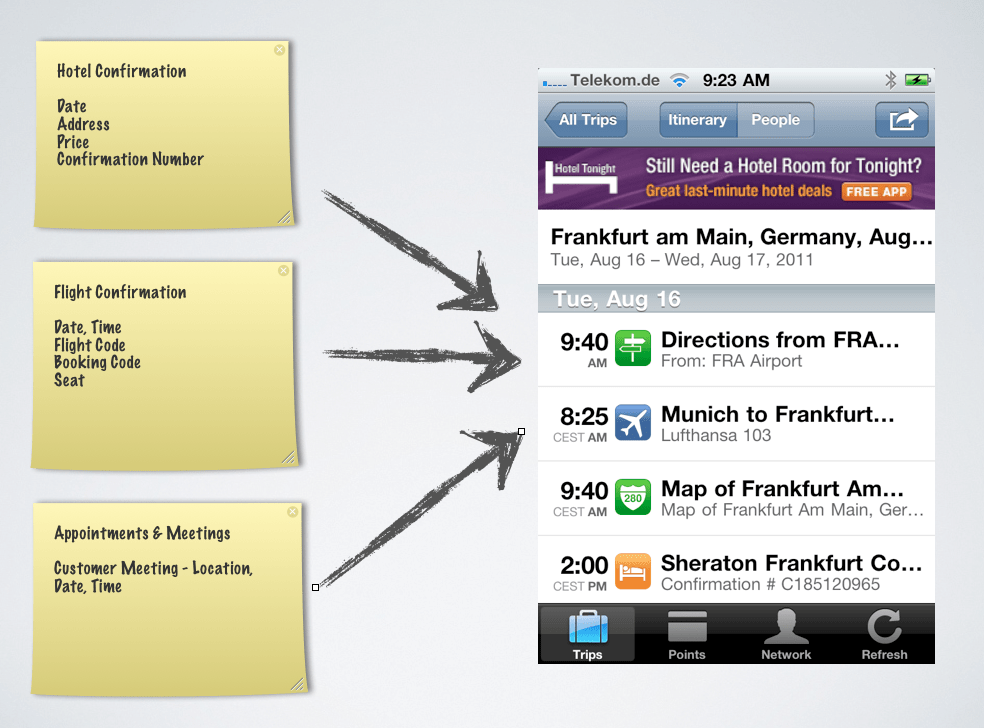
    • It consolidates all your trip information. When I receive the confirmation emails for flights, hotels, rental cars and such, I simply forward them to TripIt (my email address is registered with them). TripIt then automatically groups all related travel confirmations into trips and syncs it to the app. That alone is perfect: all travel info in one place instead of multiple confirmation emails.
    TripIt Review
    TripIt consolidates all your tip data in the app
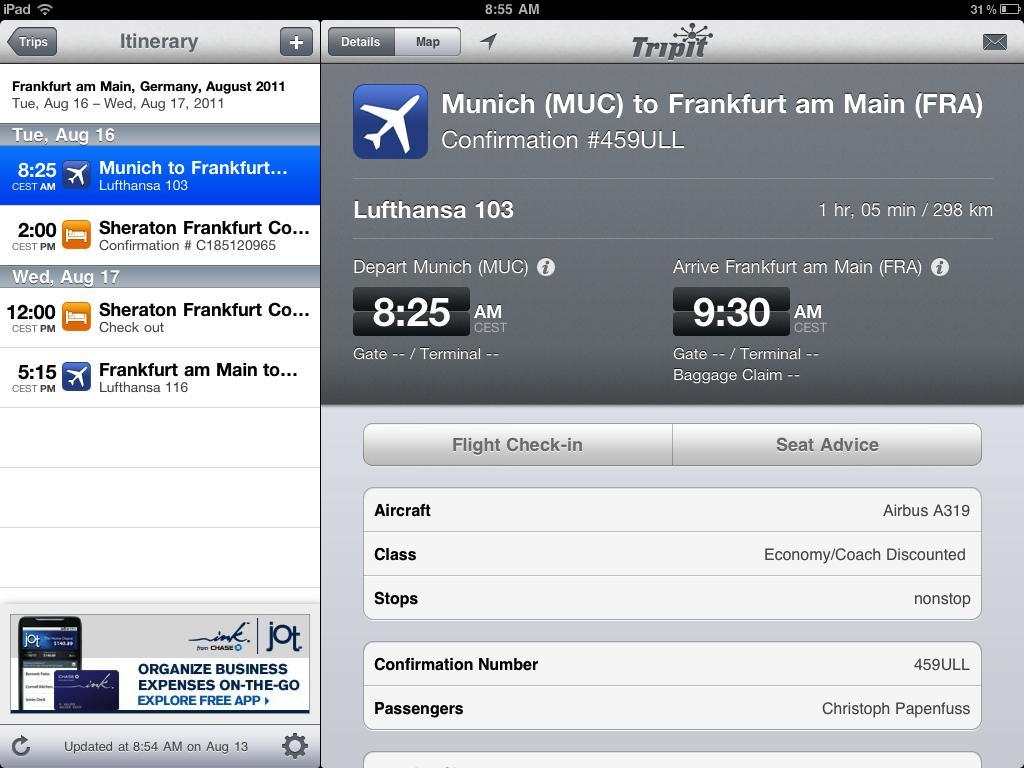
    • Once the data is in the app you can quickly retrieve all the important infos about your journey. When I check in at the airline kiosk, for example, I use TripIt to retrieve the booking code. Or when I get into a taxi, I use the app to quickly pull up the hotel name and address. No need to search for the confirmation email to pull out papers.
    TripIt iPad app
    All the infos you need
    • TripIt also let’s you share information with other travelers and that is pretty cool! Whenever I go on a trip with colleagues we share the stuff and that way we all have our flight infos etc.. No more emailing and exchanging of details. It’s right in the app with your travel data.
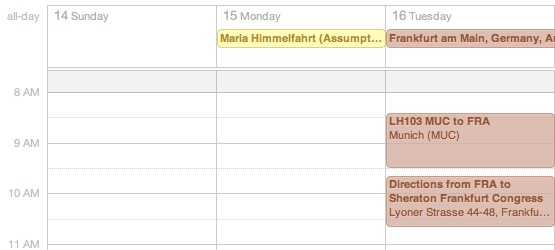
    • The app also allows provides an iCall feed that let’s you sync the trips with your different calendars. All flights, train rides & ship journeys automatically appear in my Lotus Notes and MACBOOK calendar. My wife also receives the updates.
    TripIt ical feed
    iCal feeds rock
    • Last but not least, LinkedIn & Facebook have a plugin that allows you to share the travel info with your network. I only use the LinkedIn option and do have to say it’s pretty cool. Over the past two years, I was able to re-connect with a bunch of people that I hadn’t seen in a while. People basically reach out and TripIt shows people who are close by. It’s an optional thing – I like it.
    If you travel for business, I highly recommend TripIt. It is easy to use and really simplifies managing your travel stuff. It is a solid work horse and does its job extremely well. That’s why I love this app and that’s why I wanted to share it with you! Let me know if you have other apps that make the life of a business travel easier.
  • 4 Business Analytics events you should not miss

    Business Analytics is the number topic for most CFOs and CIOs this year. Fall is a perfect time to catch up on the latest news in this area and to learn about the latest and greatest IBM solutions. The IBM teams across the globe (including my group) are currently busy organizing and preparing four major events and workshop series. If you are currently using business analytics or are evaluating it, you should definitely make time to attend one or more of these events. There will be a big focus on Cognos 10, Cognos Customer Insight and SPSS.

    • Business Analytics Forum: This event is big – IBM’s annual user conference for the Cognos, SPSS and other related products. The Forum is once again hosted at the Mandalay Bay hotel in Las Vegas. It kicks off on October 24th and runs through the 27th. The conference offers hundreds of sessions about the technology, business best practices and customer stories. There are also certification camps, EXPOs, focus groups and much more. This year we will see a special track dedicated to social media. I personally highly value the opportunity to network at this annual event. This is always a special opportunity. If you have time and budget to attend, you should sign-up soon – early-bird registration ends on August 31st! Make sure to also check out Delaney Turner’s blog post about this event.
    • IBM Performance: If you cannot attend BA Forum, I would highly recommend to sign up for one of the Performance events. They belong to my favorite roadshows. These are 1-2 day complimentary events hosted across the globe. Sessions and solution showcases help you evaluate, use and derive more value from IBM solutions for business analytics. There will be a lot of demos and information about IBM Cognos 10, along with solutions from SPSS, Clarity and Netezza. I will deliver a bunch of keynotes and presentations across Europe.
    • Business Analytics Experience: Have you ever participated in a business simulation? This is the perfect opportunity! The Business Analytics Experience workshop allows you to run a fictitious company called Future Chips. Together with other attendees, you will analyze the business, develop plans and fine-tune specific parameters such as pricing, marketing tactics etc.. The workshop is a lot of fun and really let’s you experience what it means to fully leverage business analytics. You can find out more about this in a prior post on this blog. The complimentary workshops are run across Europe and North America.
    • Best Practices in Action: Being successful with business analytics requires more than just technology. You also need to implement business best practices such as rolling forecasts, driver-based planning and such. Over the past few years, my colleagues and I have therefore developed a bunch of workshops that focus on sharing a lot of proven practices and how to best get started with implementing them. This fall we will focus on Rolling Forecasts, Budgeting and Dashboard Design. You can find out about the upcoming schedule on the Speaking & Events page on this blog. I will update that page as soon as the schedule has been confirmed. You can also find some additional information about these type of workshops on this blog.

    Hope to see you at one of these events! I

    IBM Performance
    Performance 2010 – Stop-over in Dubai
  • Dashboarding – Insights from Mike Duncan – Part 2

    Each indicator must have a strong correlation to your ability to effect change

    In my last post I laid out 3 practical and compelling questions in developing your dashboarding program:

    1. How should my company be using a dashboard(s)?
    2. What is the basic process for choosing my KPI’s?
    3. What are some common mistakes I should avoid in my dashboarding?

    Today I conclude with Questions 2 and 3.

    Selection of KPI’s

    KPI’s are dictated by the strategy of each business against the backdrop of standards or benchmarks for its industry, so every dashboard is different. Your KPI’s are singular to you and your business. While you can look to examples for general guidance, you need to work through the process of defining KPI’s for your own business.

    These questions may help you start your KPI identification and selection process:

    1. At what level of responsibility is the dashboard being used?
    2. What are the strategies and objectives that are driving the data requirements?
    3. What data provide the best indicators of performance for these requirements?
    4. How can this data be portrayed to maximize readability and minimize response time?
    5. What is the strength of the correlation between the data and your ability to influence change?

    The first two questions presume that you have already completed other required steps, such as developing a strategic plan and defining the related goals and objectives. Data points floating against dark space are meaningless. They must be oriented against your goals and industry/competitor benchmarks. The last three questions address the qualitative aspects of KPI’s.

    Perhaps the most basic consideration is reflected in the last question. Each indicator must have a strong correlation to your ability to effect change. Stated more simply, the whole purpose of dashboarding is built on the assumption that you have the ability to quickly influence outcomes as you respond to information from key indicators.

    For example, daily magazine advertising dollars spent is probably meaningless because display advertising doesn’t move sales on a daily basis and the lead time to place such ad sales is at least 6 months. You lose on both counts – sales and costs.

    Common Mistakes in Dashboarding

    These are some of the most common and harmful mistakes in dashboarding:

    • Overloading the dashboard – This is the most common mistake. Getting the most from the least is your goal. Loading every metric about your company onto a dashboard will only confuse and delay your response; equals damage to the company.
    •  Expecting too much – Dashboarding has a very specific purpose and value. It does not replace regular reporting. Don’t try to manage your business entirely from the dashboard. This will push you to put too much onto it and you will tend to lose sight of longer term trends.
    • Misreading the data – You can minimize the risk of misreading data in the KPI definition process. Choose data that is easy to interpret and consistently reliable.

    Responding incorrectly – Lives have been lost more than once from a pilot pulling up the nose when the warning system is telling him to increase altitude. He should have first put the nose down for speed to create lift needed for altitude. He thought “up,” pulled the stick and stalled the plane. Know how you are going to respond to an indicator before going live.

    Conclusion

    There are books, classes, and careers dedicated to the practice of dashboarding. It is a very important business practice and can become an invaluable business tool to make your life easier and your business more successful. Spend the time needed to do it right.


    Bizzeness - Mike DuncanAbout the author of this post:

    Mike Duncan is Partner and co-founder of Bizzeness, LLC. Mike began his career with KPMG and Deloitte. He has been a business owner and advisor for over 30 years serving over 300 businesses in various capacities. Mike focuses on SMB’s with concept development, business modeling, start-up, market adaption, strategy and succession. Mike lives in the Kansas City area. You can contact Mike at mike@bizzeness.com.

  • Dashboarding – Insights from Mike Duncan, Bizzeness -Part 1

    Your dashboard should provide the least amount of the most critical data

    In a previous post I discussed the art of dashboarding at a very fundamental level. That post sparked enough interest that I wanted to follow with more discussion about the practical aspects of dashboarding.

    Here are three of the most compelling practical questions on the subject:

    1. How should my company be using a dashboard(s)?
    2. What is the basic process for choosing my KPI’s?
    3. What are some common mistakes I should avoid in my dashboarding?

    Dashboarding in Your Organization

    You have probably seen a view of mission control during a space shuttle mission. There is a large screen on the wall tracking the most basic information about the shuttle – where it is, its projected path on the current trajectory, speed, and other basics. That is Houston’s dashboard.

    Dozens of mission specialists are seated around the large screen viewing their own small screens – their own dashboards. Each specialist has an area of responsibility, so each has his/her own dashboard, providing real time data indicating the performance of the key systems for their area of responsibility. For example, the APU specialist probably has a screen showing the amount of power from and condition of each APU – auxiliary power unit.

    Mission Control in Houston provides a comprehensive example for your own dashboarding program. The contents and use of each dashboard is determined by the goals and objectives of the user’s area of responsibility – from the big screen on the wall (responsible for mission success) to the screens on each person’s desk (e.g., responsible for APU’s).

    Each business has a unique dashboard specific to its objectives and industry, and each critical function of the business has its own dashboard specific to its area of responsibility. The CEO watches the entire business entity, the CFO watches the financial systems, the COO watches operations, and so on. For small and medium size businesses (SMB), the business owner usually gets the privilege of watching all of these areas, making their dashboarding program even more important and more challenging.

    Breaking down your organization by functions will help in the layout of your dashboarding program. Each dashboard should be designed to provide glance and go information – the least amount of the most critical data for the function. If there are multiple levels of managed responsibility, a cascading dashboard program should be used – multiple dashboards providing KPI’s for each area of responsibility.

    Next Time . . .

    Check in on my next post as I conclude with Questions 2 and 3, providing some insight into the process of selecting your KPI’s and address some of the most common and damaging mistakes people make in dashboarding.

    Mike DuncanAbout the author of this post:

    Mike Duncan is Partner and co-founder of Bizzeness, LLC. Mike began his career with KPMG and Deloitte. He has been a business owner and advisor for over 30 years serving over 300 businesses in various capacities. Mike focuses on SMB’s with concept development, business modeling, start-up, market adaption, strategy and succession. Mike lives in the Kansas City area. You can contact Mike at mike@bizzeness.com.
  • Dashboarding – A great perspective

    Dashboarding remains one of the most important topics in the Business Analytics area. Most of my clients are actively working on deploying them. Back in January dashboarding was one of the key topics at the Gartner BI Summit. The broad interest in our dashboarding workshops further shows just how important this topic is for companies.

    DASHBOARDING FOUNDATION

    Business Analytics basically allows us to make better business decisions by providing answers to three key questions:

    • How am I doing?
    • Why is that so?
    • What should I be doing?

    Dashboards do a fine job with answering the first question: You quickly assess the current situation, you identify potential opportunities and risks. But to do that effectively, dashboards need to be designed in the proper way:

    • They require the right mix of information
    • The information needs to be displayed in a manner that effectively delivers the story
    • The technology needs to support proper interaction so that the next two questions can be answered.

    BIZZENESS

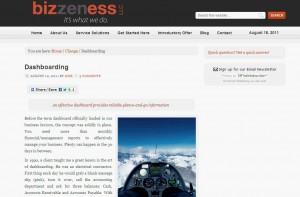
    Last week, Google+ recommended an excellent blog post by Mike Duncan from the business advisory firm Bizzeness. Mike provides some simple but very effective thoughts about dashboards. I highly recommend reading his short post. There are some great ideas in there that can help you articulate the purpose and value of a dashboard to a broader audience.

    Dashboarding Post on www.bizzeness.com

    bizzeness

    NEXT WEEK

    Mike and I ended up discussing his post via Twitter and email. I am very happy that he has agreed write two guest posts on this blog (Performance Ideas) next week. The articles will focus on interacting with dashboards, selecting proper KPIs and avoiding some common problems. Make sure to check in on Tuesday of next week or simply subscribe to Performance Ideas via RSS feed or email.

  • How to reduce detail in your forecasts

    Rolling Forecasts are quite popular today. But to implement them properly it is usually imperative to reduce the detail in the forecasting models. Less detail speeds up the process and helps to increase the accuracy.  A recent post on this blog looked at some of the problems with too much detail. The big question though is to where and how to cut detail. While people tend to look at the chart of accounts first, many organizations actually have great success with making a few modifications to their timescale.

    THE BIG SCALE

    Take a look at the photo below. It symbolizes one of the key issues with forecasting: the further out we look the more diffuse our view gets. While we might have a good idea of what is going to happen next month, it is usually more difficult to do the same for the months after. That’s just the way it is.

    Rolling Forecasts - The time horizonUnfortunately, most forecasting templates do not reflect this fact of life. Take a look at the original time-scale from a customer that I used to work with. The organization wanted to look beyond fiscal year end. However, all months were treated equally:

    A traditional time-scale (208 data points)

    Notice how much detail is being generated. And detail requires effort. As a business person, I will have to sit down and try to provide an amazing amount of detail. This could take a while. The basic assumption of this template is that business people are able to precisely quantify when something is going to happen no matter if it’s tomorrow or next year. That is dangerous and it’s simply not possible. Here is an example: I might know that a certain customer will purchase my product next month. But I will most likely not be able to precisely identify the same thing for next year. The forecast will therefore most likely be wrong from a timing perspective. Why the detail then?

    A DIFFERENT TIMESCALE

    How about changing the timescale? Take a look at the final redesign in IBM Cognos TM1:

    Rolling Forecast Model
    Less detail. Probably more accurate (112 data points)

    The new version reduces the detail by almost 50%. And this approach pays tribute to the fact that the further out we look the more diffuse our view of the future becomes. Overall, we could argue that this template will produce more accurate forecasts while also making it easier for the business. This is a lot easier to work with! My client implemented a similar timescale with excellent results.

    YOUR MODELS

    Take a look at your current models. Is there an opportunity to alter the timescale? How much detail could you get rid of? If you want to embark on implementing a Rolling Forecast, you should most definitely look at this approach. Please let me know your thoughts and experiences.