Do you know your AQ? AQ stands for Analytical Quotient. It is a new measure that provides you with insights about your organization’s ability to leverage business analytics. Most importantly, AQ helps you determine how to best go about improving your capabilities. I would highly recommend taking the self-assessment test on the IBM Website. It takes just a few minutes and provides you with very interesting feedback and ideas.
FOUR STAGES & THE NOVICE
IBM found that organizations typically go through four stages with their business analytics programs: Novice, Builder, Leader & Master. Companies that belong to the Novice category are still stuck in a spreadsheet world. And that can be a big problem. Spreadsheets are a great productivity tool, but they are not the right tool for managing your business. That raises the question: what exactly is the problem with being at the Novice stage? Let’s take a look at the Finance department as an example.
WHAT IS THE PROBLEM WITH SPREADSHEETS?
A few years ago, my team started conducting some surveys amongst finance professionals. For this purpose we teamed up with David Axson (co-founder of the Hackett Group, book author). We specifically went after professionals that were not using Performance Management software, yet (i.e. organizations that belong to the Novice category). One of the key things we were interested in was the type of work finance professionals do in these organizations. It quickly appeared that there were five major categories of work. The results from our survey looked like this:

The majority of the time is spent on manual tasks such as collecting data (loading data from systems into spreadsheets, copying & pasting, manually entering budgeting numbers, etc..), maintaining spreadsheets (developing worksheets, fixing formulas, aggregating spreadsheet data, Visual Basic programming etc.) and then also developing reports & presentations (creating spreadsheet reports, graphs, Powerpoints etc.). Only about 20% of the overall time is spent on the high-value tasks such as performing in-depth analysis, running what-if scenarios, personal development etc.. A shocking but not a surprising picture. When we present the results to finance professionals we get a lot of head-nods. But I often sense a certain level of resignation as well (“Oh yeah….I know….that’s just the way it is.”).
A COMPLETELY DIFFERENT PICTURE
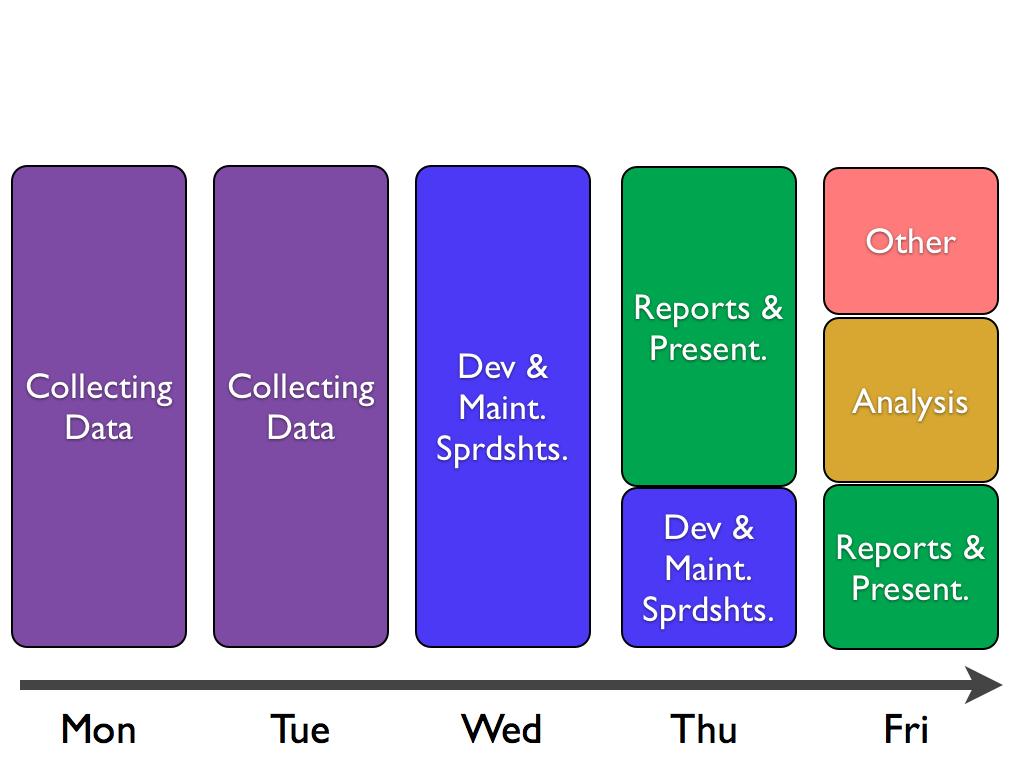
Statistics are always a bit dry. So we took the data and applied the percentage distribution to a work week. The picture now looks quite interesting. What do you think?

How does this feel? Same numbers. Just a different perspective. Two key questions come to mind: Can we live with that situation? Would we want to live with this situation? I doubt it. I have been there and didn’t necessarily like this. Sure, it’s nice to play around with spreadsheets knowing that you are indispensable. But is that what we want to get out of our professional lives? Is that why we went to business school? Is that why we spent so many hours studying for the CPA, CMA, CFA exams? This what being at the Novice stage can feel like.
MOVING TO THE NEXT LEVEL
Technology helps shift this picture around tremendously. Business analytics can help you make a lot more time for the important things. What do you think about these insights? Are you familiar with this situation? I would love to hear your thoughts and about your own experiences.

Comments
4 responses to “Why improving your AQ is critical for personal and organizational success”